Puyehue-Cordón Caulle ash circles the globe

The Patagonian experience is dominated by one thing: the wind.  It is constant, incessant, and relentless.  Windsocks at airports are permanently horizontal and the few trees that survive on the hillsides all point east.  It doesn’t even have significant gusts or lulls; it just is.

When I was there in 2004 the wind made such an impression on me that I wrote the following in an email home.

It is very windy here. […]  It has reaffirmed my faith that the world is round, because if all this air wasn’t just doing a lap of Antarctica and coming back round again, then wherever it was coming from would surely have run out by now.

This week, I saw a great image that illustrates this concept beautifully, all thanks to a volcanic eruption in Chile.

The eruption at the Puyehue-Cordón Caulle began nearly a fortnight ago, on the 4th June, producing an impressive eruption column over 12 km high and depositing a thick blanket of pumice on the surrounding landscape (Nice image gallery on the BBC website).  Since then, the finer-grained ash has been carried eastward on the wind, causing air travel disruption and pretty sunsets in South Africa, Australia, Tasmania, and New Zealand as it goes.

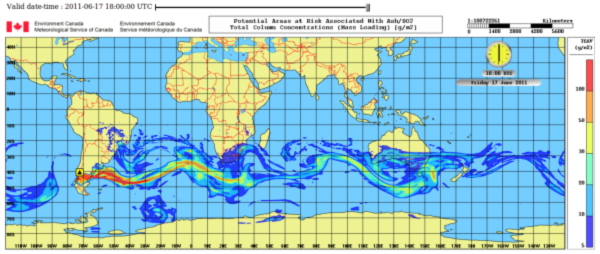
The image below is the output from a computer model simulation of the Puyehue-Cordón Caulle eruption plume.  It was produced by the Meteorological Service of Canada, using their MLDP0 computer model.  It shows the predicted distribution of the ash on Friday 17 June, with the cloud doing a lap of Antarctica and coming back round to Patagonia again.  The usual caveats and uncertainties of plume modelling apply, especially with respect to concentration estimates, which are strongly dependant on the estimates of how much ash is being erupted per second.  Consequently, they have published these maps for guidance only.  [See also the first comments, below]

Especially cool is the animated version – click here to see it.

Model of Cordón Caulle ash lapping Antarctica

Prediction of Cordón Caulle ash cloud produced by the Meteorological Service of Canada using the MLDP0 model. The ash has made a complete circuit of the globe. Click to enlarge.

Categories: Uncategorized

Grímsvötn: images of UK ashfall

In the previous post, I highlighted some indirect measurements of Grímsvötn ash in the UK.  Now that there has been time to collect and process samples there is lots of concrete, irrefutable proof that the ash cloud came over the UK on Tuesday.  I really despair at the amount of media coverage that was given to the ‘Ash Cloud Myth’ camp, as it diverted attention from legitimate and important questions such as:

  • How can we improve the way that we use satellite data and other observations to check and refine model outputs?
  • How exactly are all the possible effects of ash on an aircraft combined to determine the safe flying threshold?  What are the extra risks of setting it at 5 or 25 or even 50 mg m-3?
  • How much of the decision to fly should be with the operators, and how much with the government?

These questions are far more subtle, and the best answers will take time to find.  We have come a lot closer to them in the year since Eyjafjallajökull.  Hopefully we will be closer still by the next time.  Because there will be a next time

How many roads must a man walk down before you call him a man?

Volcanic ash, pollen, soot, mineral dust, insects and bits of leaves.  And rain.

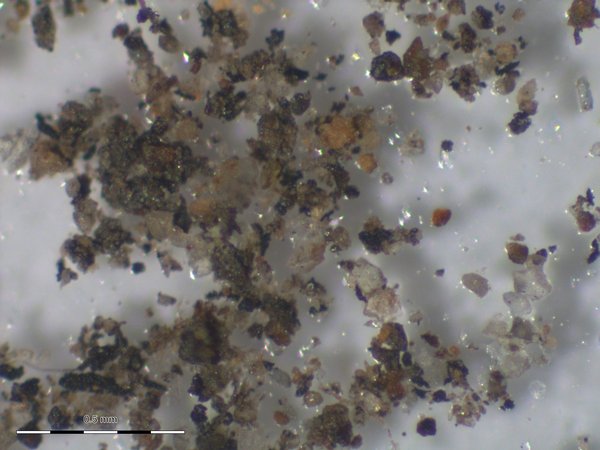
Not a very helpful answer, but that is what is actually blowin’ in the wind.  Here are a collection of images of ash samples from the UK.  They are presented in order of increasing magnification.

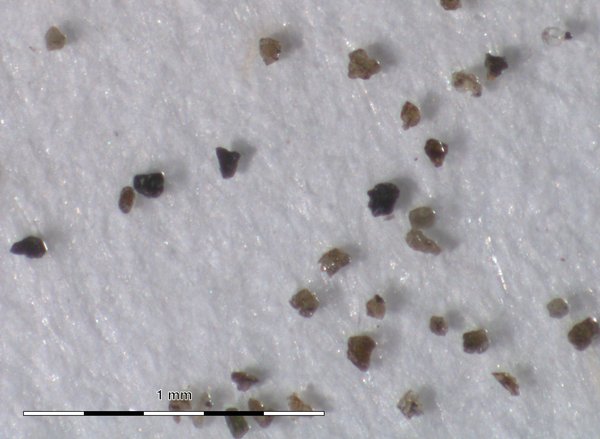
Reflected light microscope (45x magnification): sticky tape samples

The image shows what I found in my saucepan sample, collected on Wednesday night using the method described here.  Unfortunately, it doesn’t have any obvious ash in it.  Most of the ash fell on Tuesday, so I missed it here.  Some of the ash sightings during the Eyjafjallajökull eruption turned out to be false alarms, so I’ve put up this picture to show the kinds of things that are blowing around all the time.

Mineral grains in the rainwater

Assorted mineral grains collected from rainwater in Edinburgh. Most of these are >100 microns in diameter. So far, ash grains from the UK have been less than 50 microns. Other samples contained soot, insects and bits of plant material.

The British Geological Survey made a request for samples from the public, and these are beginning to arrive now.  Hopefully they will have more luck than I did.

Transmitted light microscope (500x magnification): pollen sampling slides

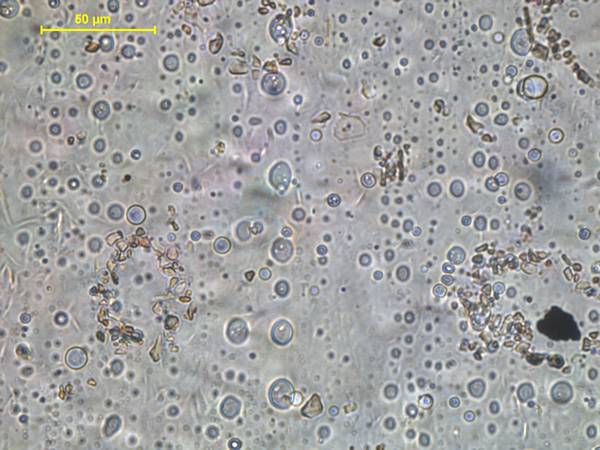
The Met Office measure the amount of pollen in the air each day, in order to make pollen forecasts.  These are useful for hayfever sufferers.  This week, the sampling equipment also trapped volcanic ash grains, which are about the same size.  The grains in the images below were collected in Lerwick and in Exeter between Monday and Wednesday, demonstrating that although the worst of the ash was in Scotland, there were lower concentrations all over the country.

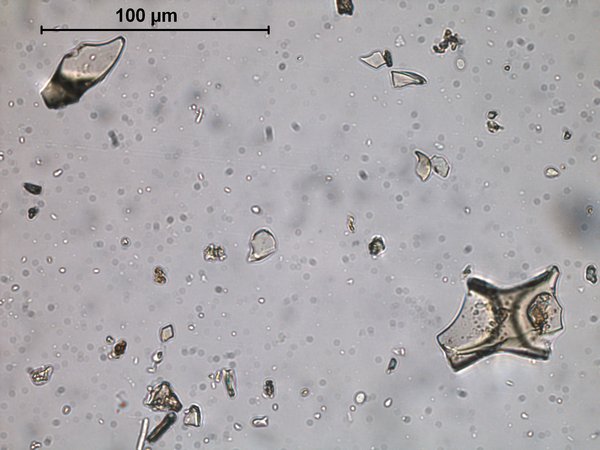
The first image shows an individual ash grain that fell in Exeter on Monday night in Lerwick on Tuesday or Wednesday.  The bigger grain is about 50 microns in diameter (i.e. you could fit ~20 of them in a millimetre).  Magma is a mixture of crystals and bubbles and molten rock.  When it freezes quickly during an explosive eruption, the molten rock turns into glass.  You can see the glass and bubble shapes clearly in this grain.  (Compare it with an Eyjafjallajökull grain shown in this post.)

Ash grains from Lerwick

Basaltic ash grains from Lerwick. The larger grain shows bubble-wall shapes. The right-hand bubble contains finer ash grains inside it. Note: the original edit of this post featured a grain from an Exeter pollen slide; this image replaces that one.

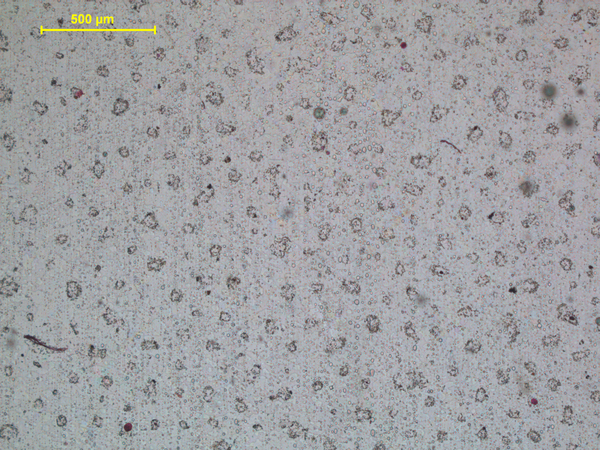
The second image is from Tuesday’s slide.  What looks like leopard-print wall paper is actually a fossilised rain shower.  Each of the little circles was an ash-filled raindrop that was collected on the sample slide.  Rainfall (or ‘wet deposition’) is an important factor in removing ash from the plume.

Exeter pollen sample slide

A fossilised rain shower. Drops of ash-laden rain landed on the Met Office pollen sampling slides.

The third image is a close-up of the fossil raindrops.  Each one forms a ring about 50 microns wide, and consists of 50-100 grains of ash, each only 5-10 microns in diameter.  The clear, round blobs that form lines down the image are bubbles in the glue on the slide.

Exeter pollen sample slide zoom

Close up of the pollen sample slide, showing rings of tiny individual ash grains.

Scanning Electron Microscope (~2000x magnification): rain-washed dust

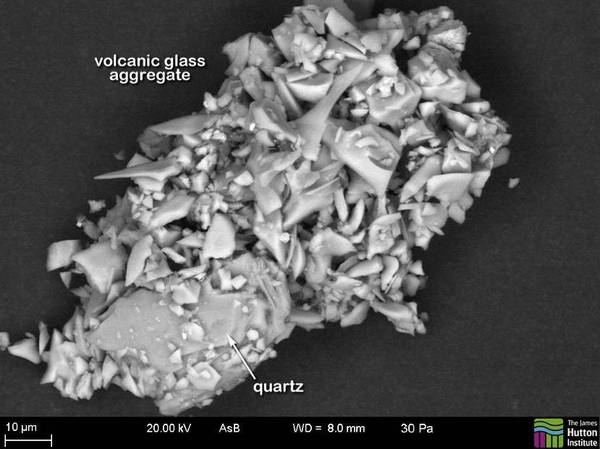
The ash grains that have reached the UK are generally very small, so a scanning electron microscope is used to get a good look at them, at magnifications of 2000x or sometimes more.  A sample of dust from a car parked in Lerwick, in the Shetland islands, was analysed by the Scottish Environmental Protection Agency.  It was found that the dust contained thousands of tiny (less than 10 microns), ash shards.  Many of these had clumped together to form ‘aggregates’.  Aggregate formation is another important process in deposition of ash from a plume, because a big clump of many grains will fall to Earth much more quickly than the individual grains would do alone.

SEM image of volcanic ash

SEM image of volcanic ash from the SEPA website.

The image shows a quartz grain amongst a cluster of tiny ash grains, but you wouldn’t know it just by looking at it.  The composition of the grains is worked out using a technique called Energy Dispersive Spectroscopy.  This works by using the electron beam to knock other electrons out of the atoms in the sample.  The gap is filled by another electron from within the same atom, and energy is released as an X-ray.  The wavelength of the X-ray is specific to the type of atom e.g. iron is different to magnesium is different to lead.  By measuring the wavelengths of all the X-rays, you can tell which types of atoms are in your sample.  Quartz (chemical formula SiO2) produces big spikes corresponding to silicon and oxygen.  Volcanic glass contains a huge range of different elements (silicon, oxygen, aluminium, iron, magnesium, calcium, sodium….).  This is how they worked out what each grain was.

Have a look at the SEPA website for the full report, which contains lots of other nice images.  The British Geological Survey has SEM images on their Grímsvötn page, too.

EDIT 01/06/11: Replace image of individual tephra grain with Lerwick example.
Categories: Uncategorized

Grímsvötn: eruption ends, UK ashfall, mapping the plume

The Grímsvötn eruption ended today, but there is still plenty of ash up there.  Despite contrasting views in the press, firm evidence that the plume crossed the UK is slowly surfacing.  Discussion has moved on from volcanology, to detecting and predicting ash clouds.  There are still many interesting questions to think about…

So the eruption is over, just like that?

Yes.  From a 20 km high, billowing, lightning-lit column of pulverised rock, the eruption plume has declined to just a steady venting of steam and Iceland’s most powerful eruption in 50 years has fizzled out.  The contrast is stark, as can be seen in photographs on Erik Klemetti’s Eruptions blog.  The eruption followed the same pattern as a number of previous Grímsvötn eruptions, with the rate declining as the pressure in the magma chamber was released.  Imagine using up a deodorant aerosol in one go: it blasts out quickly at first (SSKKKOOOOSSSSSSHHHHH!!!!) then fades away to a pathetic hiss (sss…ssssss….sss….ss).  The process is the same.

Excellent!  So I don’t need to worry about my flight on Friday, then?

Hopefully not.  The eruption was really big, though.  This animation demonstrates the power of the plume.  Comparing it with other eruptions that had similar-sized plumes, it is probable that around 0.5 cubic kilometres of material were ejected.  Much of that material is still up in the atmosphere.  The Met Office models show the huge area that it covers.  Some further disruption is not impossible while the remaining ash disperses.

Met Office prediction

The Met Office prediction of the ash cloud distribution for Wednesday and Thursday.

But lots of people are saying that there was no plume at all.  Are they right?

No.  They are wrong.  Unfortunately, the speed of the scientific process is nothing in comparison to that of a certain Irishman’s tongue, but the evidence is beginning to come together that the plume crossed the northern part of the UK yesterday as predicted.  So far, we have indications from satellite data, observations by the public, and air quality monitoring data.  All of these will be scrutinised and double-checked in the future, but the case is already very compelling.  [Note: the purpose of this section is to demonstrate that the ash cloud is real.  It doesn’t give sufficient information to say whether or not the concentrations of ash are safe to fly through.]

Satellite data

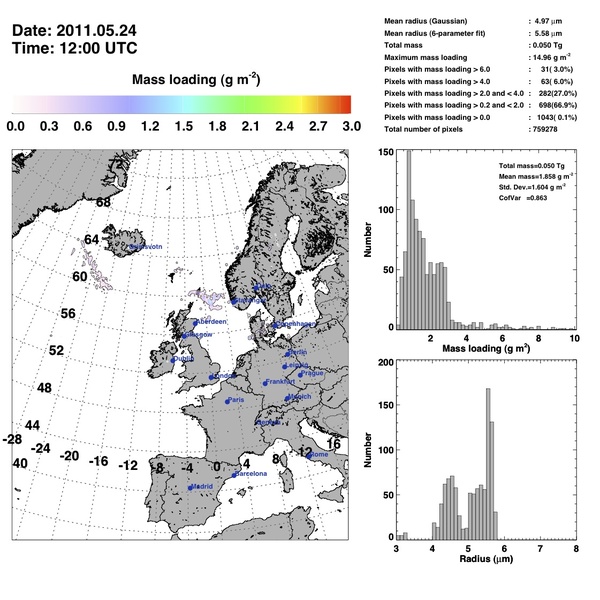
The figure below shows data from the SEVERI infrared detector on the European Meteosat-9, processed by the Norwegian Institute for Air Research.  The image shows patches of ash over the Atlantic and the North Sea.  But the image is just a taster; the animation is a must-see!  Click here to watch it.  Remember that the scale on the image is in grams-per-square-metre, the thresholds for aircraft safety are measured in milligrams-per-square-metre.

Map of Grímsvötn ash as detected by the SEVERI instrument.

Observations by the public

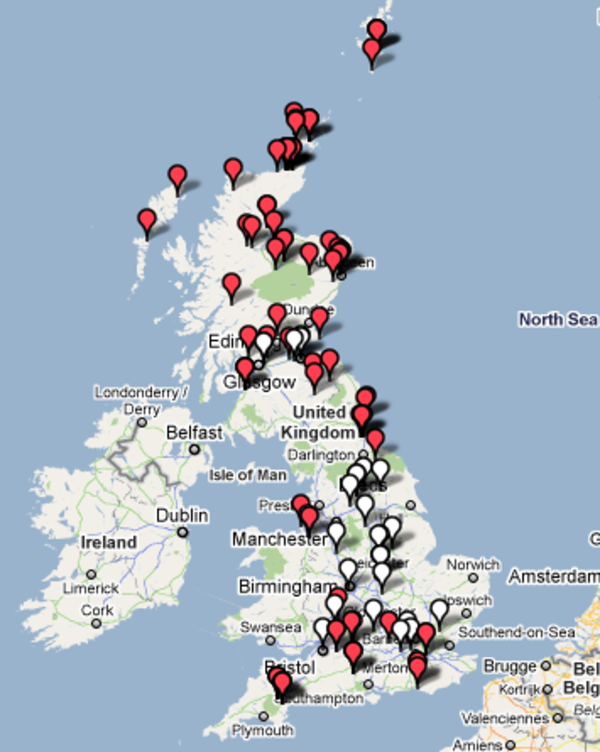
The British Geological Survey set up a webpage where people could report ash fall in their area, similar to one that they use for reporting earthquakes.  The results are below.  How much you trust them depends on how much faith you have in the British public.  The high density of points in Scotland, where the population is much lower, and the large number of negative findings in the South East are certainly consistent with the ash cloud crossing northern Britain.

Map of reported ash fall

Map of reported ash fall from the BGS website. Red markers have ash, white ones don't.

Furthermore, volunteers from across the country were collecting samples of this ash.  These are being sent to the BGS for analysis.  Results should begin to come out in the next few days.

Air quality monitoring data

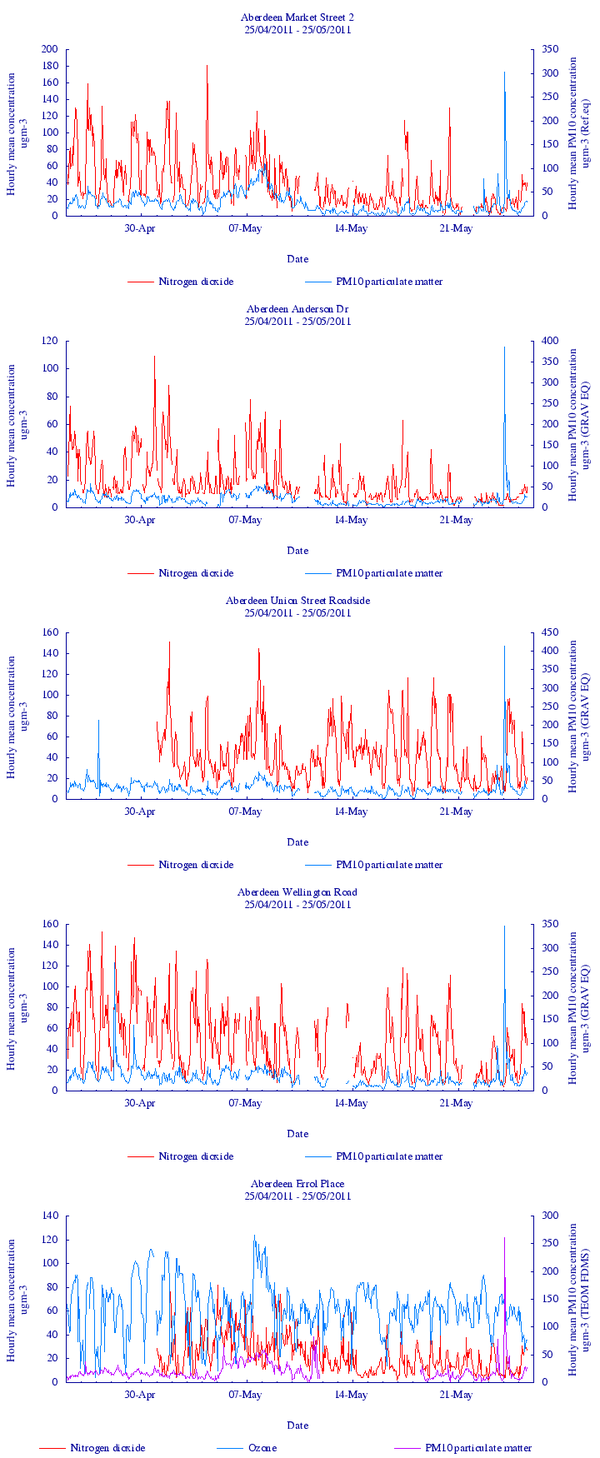
There is a network of air quality monitoring stations across the UK.  Many of them publish their data online, so that they can be accessed by the public.  One of the parameters measured is PM10 (particles less than 10 microns in diameter).  Many of the ash particles in the plume will be less then 10 microns in diameter.  The International Volcanic Health Hazard Network have information on the health risks of ash on their website.  The following plot comes from the Scottish Air Quality website, and shows data for all of their sites in Aberdeen.  There is a clear spike in PM10 levels at every site on Tuesday 24 May.  Aberdeen airport was closed on Tuesday.

Aberdeen air quality

Air quality data for sites in Aberdeen from the Scottish Air Quality website. While there is a fair amount of background noise, the sharp peak in every station on Tuesday is clear.


Do you know, I’ve always wondered how people can make maps of the ash cloud thousands of kilometres away from the volcano.

Really?  Well that is a truly incredible coincidence.  Only this afternoon, I took part in a live Q&A session on the Guardian website about his very subject!  I’ll summarise the most relevant excerpts for you below.  You should also check out the original site for more, and to read answers from Dr Colin Brown from the Institute of Mechanical Engineers about how much ash a jet engine can tolerate.

Why are the forecasts so vague?

Because tracking an ash cloud is an extremely difficult thing to do.  The distances are huge, and the concentrations that correspond to the safe flying threshold are tiny.  Both empirical measurements (e.g. satellite data, direct sampling) and computer models (e.g. the Met Office’s NAME model) are used.  Neither strategy is perfect, and each has it’s own advantage and disadvantages.  In reality, both need to be used to make decent maps of where the ash cloud is present.

OK.  Tell me about measurements first.

Satellite data can be used to track the plume across the Atlantic. Visible light images (e.g. photographs) could show areas of high ash concentration, but only during daylight hours and if the ash was above the meteoric (weather) clouds. Ultraviolet images are able to pick out sulphur dioxide, but it is unclear whether it can travel separately from the ash. Thermal infrared (TIR) images are useful, because they contain information about both the extent and the altitude of the ash cloud. If you assume that the ash has the same temperature as the surrounding air (which is reasonable given the small size of the grains), and we know how the temperature of air changes with altitude, then you can work out its altitude from its temperature. This method falls down, however, if there are meteoric clouds at similar altitudes in the area, as they will also emit thermal infrared.

Using lasers in space, the altitude of the ash cloud can be checked, and the thickness could be measured. When people went through the data from the Eyjafjallajökull eruption, they found that the TIR methods underestimated the altitude of the ash by up to 1.5 km. The thickness was usually <1 km. Using a combination of TIR and lasers in space, the mass of ash in the cloud was estimated, but the uncertainties were around 40-50%. Ground based lasers were also able to measure the height and thickness of the cloud, and gave confirmation of ash above a number of locations across continental Europe. Ground-based lasers (LiDAR) have the disadvantage that they can’t see through cloud, and only give information at a specific point (or along a narrow track in the case of a satellite-based system). Knowing the ash content above Manchester is of little help to a 747 over the middle of the Atlantic.

Sounds complicated.  So are models the answer, then?

Because measurement techniques are so strongly conditions-dependent and spatially limited, models are necessary to fill in the gaps.  The models can give you a result for any time and place, irrespective of other factors. The way that they work is quite straightforward.

Imagine an ash grain, falling through the sky.  The aim of the model is to work out how it moves during each second (or other time step) of the modelled time period.  The motion is a controlled by four factors:

  1. How big the grain is, because fall velocity is size dependant. This controls how far it falls in each step.
  2. The local wind direction. This controls the sideways movement of the grain for each step.
  3. Some turbulence factor.  This controls how particles spread out to form a cloud.
  4. The weather. Because the rain will wash some grains out.

Adding up all the movement during all the steps over hours or days will show where the particle goes. All of this processing is very computer intensive, so it is not realistic to try to simulate each of the bazillion gazillion ash grains produced by the eruption.  Modelling a few thousand turns out to be sufficient to see how the plume spreads and to make a map of where it is.  You can do this for any time period or location and the data are 3D, so individual layers in the plume can even be identified.

So what are the disadvantages?

The disadvantages of the computer models is that they are only computer models.  The results are only as good as the data that is put in.  This means that errors in particle size distribution, or weather data will lead to errors in where the particle ends up. There is an unavoidable degree of uncertainty in each of the input parameters.  How can you ever expect to know the exact wind speed and direction at 100 m height intervals at a given location 200 km west of Shetland?

And it gets worse.  If you just want to know where the plume is you can simply draw an envelope round all the particles.  But now the airlines demand to know the mass concentration of ash at each point.  You can easily calculate this by assuming that each modelled particle represents some number of kilograms of ash, but getting this number right depends on knowing the mass eruption rate of the volcano. As I wrote in a post last month, this is easier said than done.

I see what you mean that neither strategy is perfect.

Exactly.  Which is why both are required.  The models produced by the Met Office aren’t just spat out of the computer and sent out to the airlines; they are compared against satellite data and anything else that is available and adjusted accordingly by experienced weather forecasters.  This ensures that the strengths of both measurements and models are combined.

The results are still full of uncertainty, but this is not because of a failing on the part of the scientists.  It is because producing accurate maps of the ash distribution is an extremely difficult thing to do.  This situation can only be improved by increased funding for research and equipment to pay for things like LiDAR on the Faroe Islands, or a fleet of dedicated research planes, or more studies into the relationship between eruption style and mass discharge rate.

Clive Oppenheimer, a volcanologist at Cambridge, wrote a good piece about how difficult it has been to secure funding for this kind of thing.  Realistically, a lot of the money needs to come from the airline industry.  Uninformed, attention-seeking criticism doesn’t help anyone.

EDIT: 2011-05-26 10:25.  Added IVHHN link.
EDIT: 2011-06-22 10.35.  Added note on whether ash is safe to fly through.
Categories: Uncategorized

Grímsvötn eruption: more questions and answers

As the eruption continues, here are some answers to some more common questions.

Flights are being cancelled.  Does that mean that ash is reaching the UK?

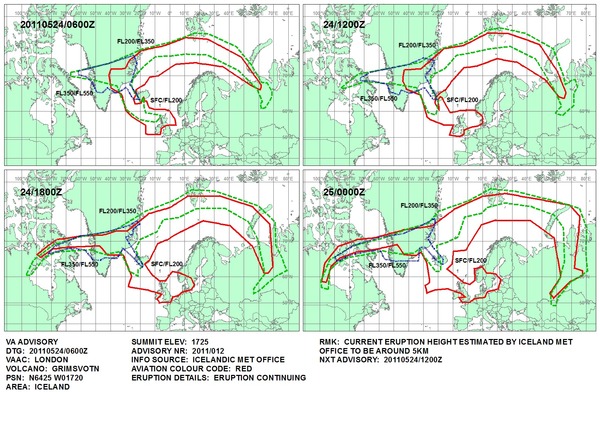
Yes.  It is falling in the Orkneys as I write this and the Met Office charts show the cloud above the UK on Tuesday and Wednesday at least.

Met Office predictions for ash dispersal

Met Office predictions for ash dispersal on Tuesday and Wednesday (24th, 25th). The map shows ash being blown across the UK.

But I heard that the ash grains from this eruption were too big to reach us.

It is true ash being produced by the Grímsvötn eruption is generally coarser that that from Eyjafjallajökull last year, but that is not the whole story.  Volcanoes can eject magma at all sizes, from car-size blocks to tiny grains a millionth of a metre across.  There is not just one unique grainsize, but a grainsize distribution.  The fine ash (<64 microns) causes most problems, because it can travel further from the volcano before falling to the ground.  All explosive eruptions produce some fine ash, but the relative proportion can vary.

OK.  So is the problem that the Grímsvötn eruption is really big?

Exactly.  Even if the eruption was producing only 50% as much fine ash as Eyjafjallajökull, the material was being produced over 100 times more quickly, so we still end up with a lot of ash floating about.  You can see what I mean with this simple two part experiment.  (If anyone actually tries this out, can you post a video on youtube, please?  I’d love to see it!)

Part 1:

  1. Mix together 2 parts icing sugar, 2 parts castor sugar, 2 parts coarse brown sugar and 2 parts sugar cubes in a coffee mug.
  2. Go outside, and throw the mixture as high as you can up into the air.
  3. The result is sugar cubes scattered around your feet and a puff of sweet-tasting dust drifting off in the wind.
  4. Repeat steps 1+2 every half hour for a whole day. This is Eyjafjallajökull 2010.

Part 2:

  1. Mix together 1 part icing sugar, 1 part castor sugar, 3 parts coarse brown sugar and 3 parts sugarcubes, this time filling up a really big sauce pan.  Proportionally, this has half as much fine ash as before.
  2. Go up to the second floor and throw it out the window.  This is Grímsvötn 2011.

We’re flying to Austria on Saturday.  Do you think that we’ll get away?

As always, it depends on a combination of the weather and what the volcano is up to.  I think that the chances are good, though.  The low pressure system that was blowing the ash towards us will move past in the next day or so, and all indications are that the eruption is fizzling out.

How can you tell that the eruption is ending?

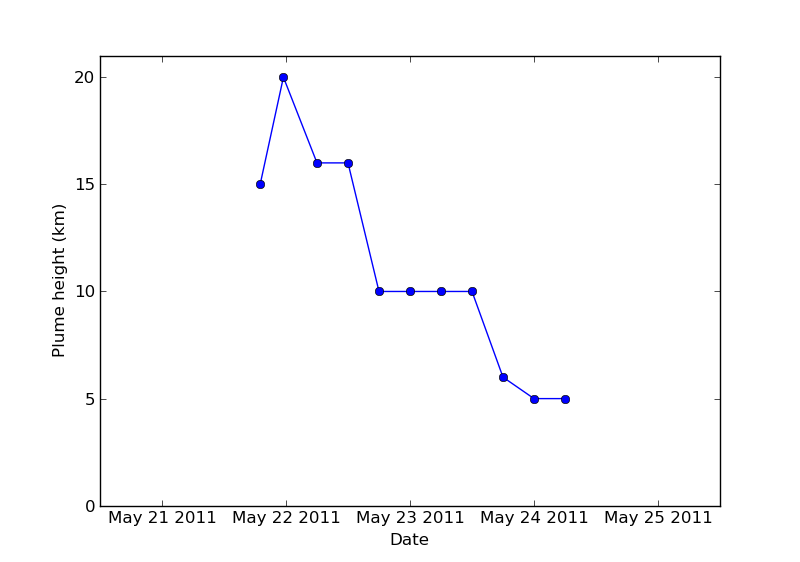
The height of the eruption column has been declining, from 20 km on Sunday down to ~5 km at the moment.  The height of the column is very sensitive to rate that material is erupted from the volcano, such that a halving in column height implies that the eruption rate has declined to a 16th of what it was before.

Declining height of the Grimsvotn plume

Changes in height of the Grímsvötn plume. The decline corresponds to a massive reduction in the eruption rate. The plume heights are taken from the Met Office website.

Are there any other signs?

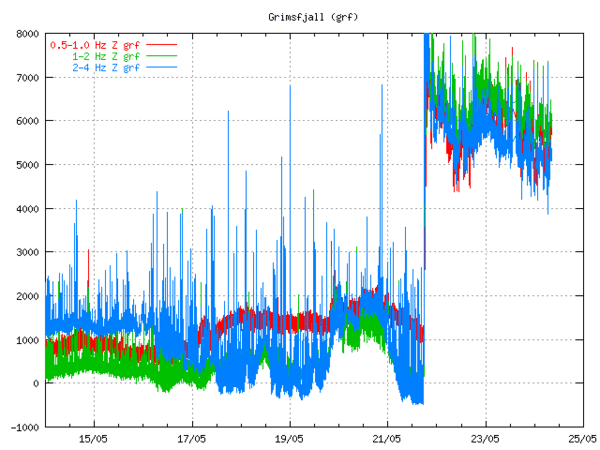
Yes.  Seismometers at the volcano have measured continuous small earthquakes during the eruption.  This is called tremor, and is caused by movement of magma within the volcano.  The intensity of the tremor has been declining since the eruption began.

Tremor data from Grimsvotn

Tremor data from Grímsvötn, showing high, but declining tremor since the eruption began on the 21st May. The plot comes from the Icelandic Met Office website.

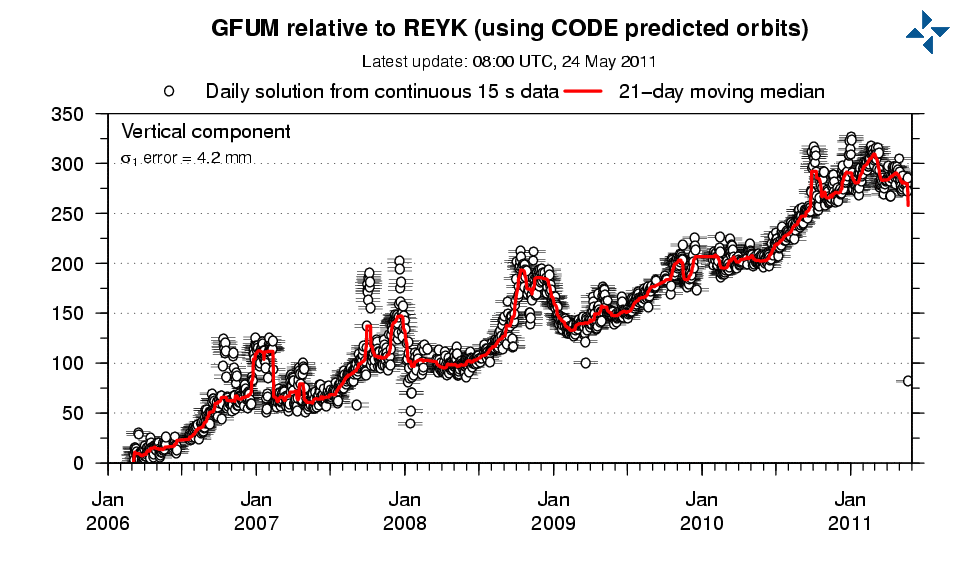
Also, GPS measurements on the volcano detected the surface gradually rising since the last eruption, as the magma chamber beneath it inflated.  Since the eruption began, the data show a subsidence of 25 cm, as the pressurised magma within the volcano is erupted and it deflates back down.  With the pressure in the magma chamber released, the eruption will only pick up again if fresh magma arrives from deeper in the system.

GPS data from Grimsvotn

GPS data from Grímsvötn, recording the inflation of the volcano over the last 5 years. The final datapoints record a big deflation during the eruption. The plot comes from the Icelandic Met Office website.

Therefore, unless another vent opens or new magma is injected, it is probable that the eruption will not pick up again and will end completely in the next few days.

So will the ash just disperse?

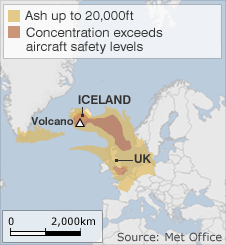
Yes.  The ash above us at the moment was erupted early in the eruption, and the current eruption rate is too low for newly-erupted ash to cause problems in Britain.  As the cloud disperses some of the finest grains will remain airborne for days, but their concentration will be too low to cause problems.  The new flight rules brought in during the Eyjafjallajökull eruption will get flights back in the air quickly, too.  This plot from the BBC website last year shows how the area of airspace that would be out of action is made much smaller by the threshold-based system.

Flight rules and the no fly zone

A map published on the BBC website during the Eyjafjallajökull eruption. It shows how changing the rules so that planes only had to avoid ash above a certain concentration (red) instead of avoiding all ash (orange) opened up large areas of airspace.

Will we see ash falling here?

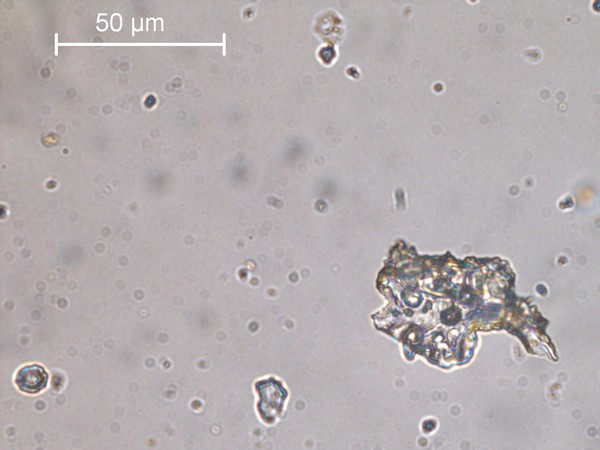
I hope so.  Last year some people saw ash falling, but the majority just saw blue skies.  This even led some people to say that there was no ash there at all.  They were the first ever Ash Cloud Sceptics.  They were wrong.  Ash grains fell through the air, and in the rain.  The figure below shows an example.  The ash cloud was measured by lasers on the ground (LiDAR), and sampled during special research flights.  The lasers and research planes will be in action again this week.

Ash grain from Eyjafjallajokull collected in UK rainwater

An ash grain from Eyjafjallajökull that was collected in rainwater near Leicester during the eruption last year. Note the glassy, translucent texture, angular shape, and bubbles in crystals within the grain. This grain was transported to the UK in the ash cloud.

With the high winds and the rain, it may be very difficult to see the ash grains.  They will be very small, like dust.  If you do find some settling where you are, the British Geological Survey would like a sample!  Visit their ash collection website to find out how you can help.

The weather has been wild the past few days, and those scenes from Iceland are positively hellish.  Does this have anything to do with the Rapture?

No.  This has nothing to do with the Rapture.  Was the end of the world also foretold by the Grímsvötn eruption in 2004?  Or the one in 1998?  How about 1996, 1984, 1983, 1972, 1954, 1948, 1945, 1941, 1939, 1938, 1934, 1933, 1922, 1919, 1910, 1902, 1897, 1891, 1887, 1883, 1873, 1867, 1861, 1854, 1838, 1823, 1816 or any of the hundreds before that?  No.

Categories: Uncategorized

An easy way to sample falling ash (updated to include wet sampling)

Ash from the ongoing Grímsvötn eruption is predicted to arrive over the UK from Wednesday morning.  At the moment it is hard to tell what it will be like.  Certainly, it will not be like the scenes in Iceland where it has blanketed the ground like sandy grey snow.  Perhaps it will just make the rain a bit dirty.  During last year’s Eyjafjallajökull eruption, people across the UK reported ash grains in the air or grey dust spoiling their newly-cleaned cars.

It would be amazing if we could make a map of all the places in the UK where people see ash falling.  The results would be extremely useful to help test the predictions of ash dispersion made by computer models.  Also, ash layers from past eruptions are found in lakes and peat bogs across Europe and are used by archaeologists to correlate the ages of ancient settlements and remains.  If we can measure how the ash falls in a current eruption, it will help us understand how layers from past eruptions have formed.

Coordinated sampling effort

The British Geological Survey are coordinating a nationwide collection of ash during the current Grímsvötn eruption.  If ash falls where you live, then they want a sample!

A simple procedure has been put together to help you to collect a useful sample.  You can read more about it on the BGS Grímsvötn Ash Collection website.  It is very quick and easy.  If you see ash falling, then get out your sellotape and see if you can get a sample.  The following video demonstrates the method:

What the samples can tell us

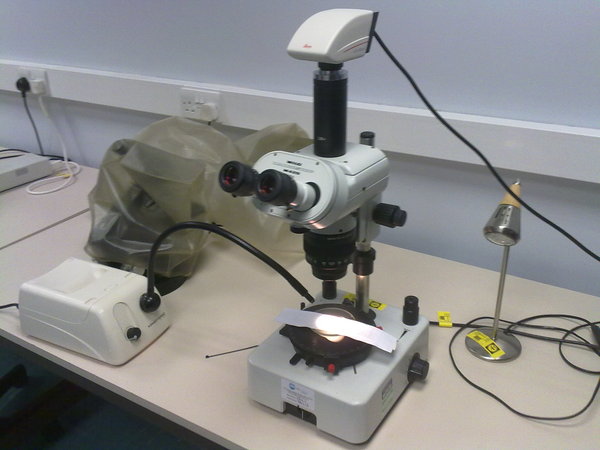
The two methods of sample collection shown in the video can be used when ash is falling from the sky.  The first, and easiest method, results in a paper ‘slide’ that can be looked at under a microscope.

A paper slide under the microscope

A paper 'slide' being examined under the microscope.

If the grains are big enough, it will be possible to recognise whether they are ash or not and, using the very important information written on the paper, to make a map of where ash fell.  It is important that if you decide to take a sample, that you send it in.  Even if it doesn’t look like it has much on it.  We also need to know where ash is not falling.

Ash grains on a paper slide

Ash grains on a paper slide can be identified based on their colour, their shape and whether they contain bubbles or small crystals. Each sample can be checked quickly to see if it contains ash. The most important information is where in the UK ash was actually falling.

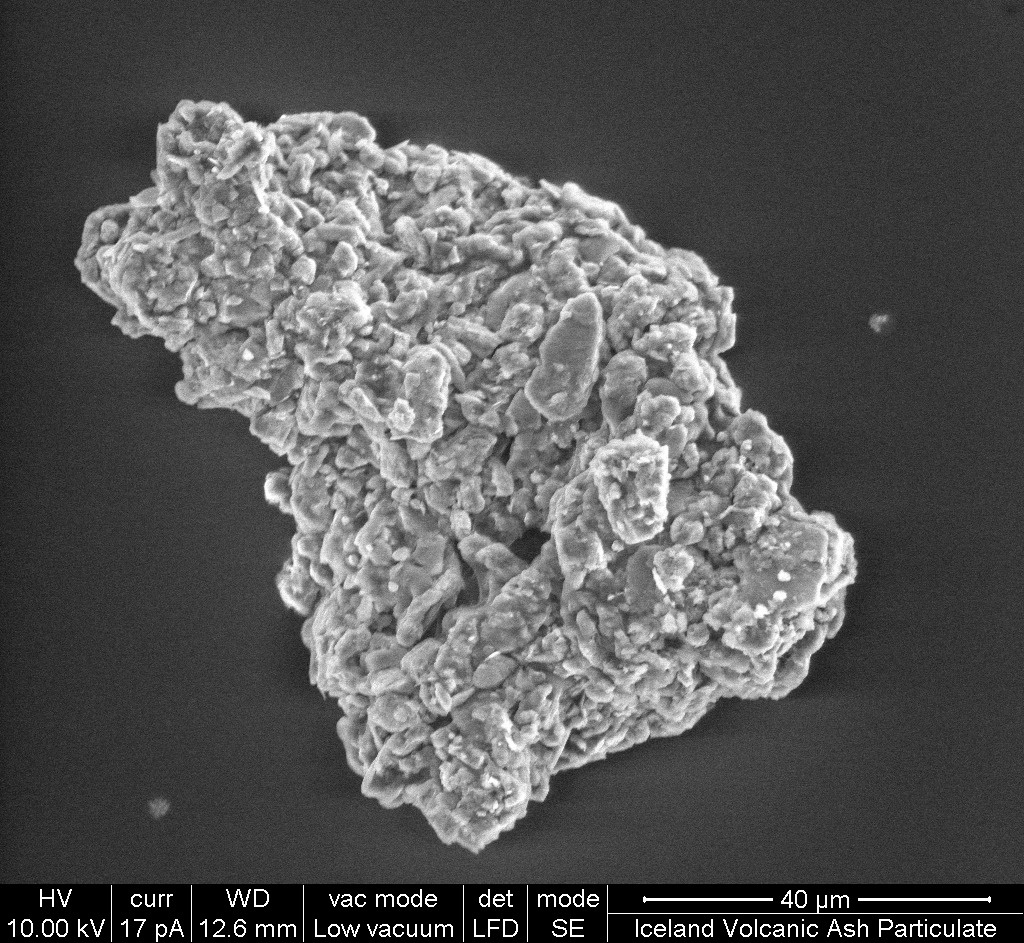
The second method is a bit more complicated, but allows the samples to be examined by the Scanning Electron Microscope (SEM).  An SEM can take images at over 1000x magnification, letting us see small details of the ash such has how bubbly it is.  It can also show if tiny ash grains have clumped together into bigger ones, called aggregates.  The SEM is even able to give us a rough idea of the chemical elements that the ash contains.

Aggregate grain under SEM

An SEM image of an 'aggregate' grain from the 2010 Eyjafjallajökull eruption. This grain fell near Loughborough. It is made of tiny particles stuck together. The grain is tiny. It is only 100 microns long, which means that 10 of these grains could fit in a millimetre. Aircraft and satellites detected grains that were even smaller.

Sampling in the rain

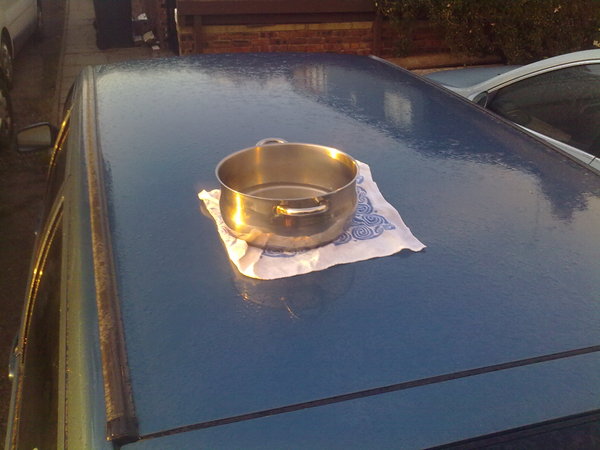
It’s fairly windy and rainy across the UK today and tomorrow.  A lot of the ash will come down with the rain.  An easy way to collect this is by putting out the biggest saucepan that you have.

  1. Put the saucepan on a raised platform, so that dust blowing near the ground doesn’t get in.  Make sure that it has a clear view of the sky and is away from trees etc.
  2. Fill the saucepan with 2 cm of water.  This will give it some weight to stop it blowing away, and the water will trap any particles that fall when it isn’t raining so that the wind can’t pick them up again.  Leave it out until the cloud has passed (estimated to be by Thursday night).

    A saucepan out to collect wet samples

    A saucepan can be used to collect wet samples. Place it on a raised surface, away from trees. Here a car roof is used, with a towel to protect the paintwork. Putting water in the saucepan weighs it down and helps it trap ash.

  3. When you bring the saucepan inside, scoop any floating debris e.g. leaves/insects from the surface (a sieve is handy for this).  At this stage, it might not look like you have much, but persevere as the ash grains may be very small.
  4. Now we need to get rid of the water.  Swirl the water, then place the saucepan beside your sink, using a wooden spoon to tilt it so that ash collects along one edge.  Leave it for 5 minutes; this gives all the grains time to sink to the bottom.  Then use a spoon to scoop out most of the water, trying not to disturb the ash.  Don’t move the saucepan.  This bit is quite tricky.  If you stir the water up by accident, leave it for another 5 minutes then continue.

    Preparing to spoon out the extra water.

    Excess water is spooned out of the saucepan. Tilting it on a wooden spoon concentrates the ash at one side and lets you get more water out.

  5. The rest of the water is gently evaporated off, either by leaving the saucepan on a radiator, or by putting it in the oven at 60 deg C.  The water should not boil.  Depending on how much water is in the pan, this could take a few hours.
  6. When you are sure that things are dry, use a piece of sticky tape (~10 cm long) to ‘mop’ up all the grains.
  7. Stick the tape to a piece of plain white paper and label with the same information as the other tape samples (example below).  Measure your saucepan, then add the following to the label:  WET SAMPLE – SAUCEPAN DIAMETER XX CM.  If you have lots of material, use more tape and stick it to the same paper strip.
  8. Send in the sample as normal.

Important information to include on label

An ash sample is useless if we don’t know where or when it was collected, or over what area.  Any samples should be labelled with the following information:

Postcode (e.g. M20 4LZ)
Town: (e.g. Manchester)
Date: (e.g. 22 May 2011)
Sample collection time: (e.g. 13.00 – 21.00)
Email address: (e.g. a.b@c.com)
Extra collection information: (e.g. WET SAMPLE – SAUCEPAN DIAMETER 22cm)

The time information may need a start date and an end date.

We need data from all over the country

We need samples from all over the country, so tell all your friends.  The Hebrides, the Highlands and Northern Ireland are the areas predicted to see the most ash.  But don’t let that stop you if you live further from the volcano.  Perhaps your town can get the record for “Furthest South” or “Furthest East” confirmed Grímsvötn ash.  Also, the call for samples is not restricted to within the UK.  If any ash makes it to mainland Europe, then those samples would also be extremely welcome.

Happy sampling!

(Updated 24 May, 23.21 hrs.  Reason – wet sampling method added).

Categories: Uncategorized

Grimsvötn eruption – frequently asked questions

Iceland’s most active volcano, Grimsvötn, began erupting last night.  Fire and Ice yet again, baby!  Here are some answers to questions that you might have.

Why are you so excited?

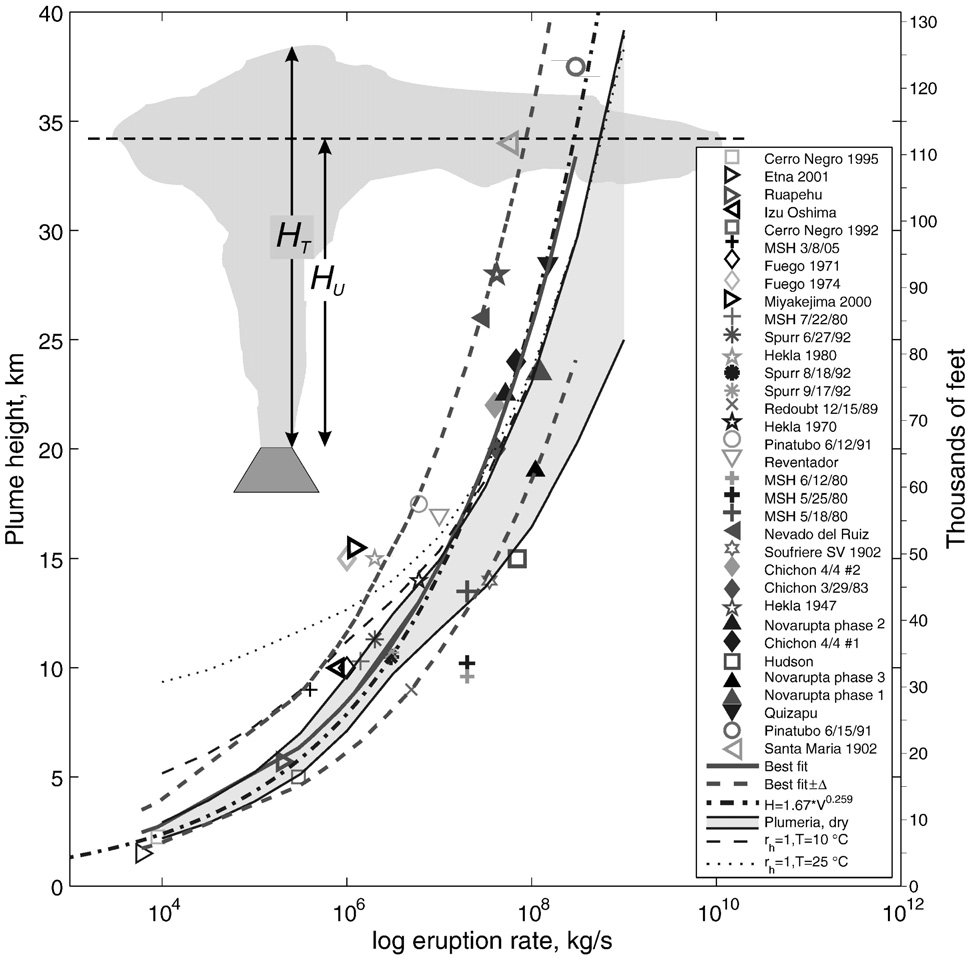
Because it’s big!  This is the most powerful eruption in Iceland in over 50 years.  Radar measurements, pilot reports and ground observations estimate that the ash-rich eruption plume reached 17 km last night.  By comparison, the Eyjafjallajökull plume of last year was 6-9 km high.  This is important because every extra kilometre of plume requires a much faster eruption rate.  The diagram below, taken from a paper by Mastin et al (2009) compares data from past eruptions.

The diagram shows that an eruption such as Eyjafjallajökull, with a plume of ~7 km corresponds to an eruption rate of 105 m3s-1 (10 x 10 x 10 x 10 x 10, or 10,000 cubic metres per second).  This is equivalent to a few hundred tonnes per second in mass. An eruption with a 17 kilometre plume could have a discharge rate of 107 to 108 m3s-1, meaning that it is producing between 100 and 1000 times more material every second. These calculations are obviously only rough, and there are lots of complicating factors such as local weather conditions, the presence of ice over the vent and whether this comparison is even appropriate for the Eyjafjallajökull plume which was not as sustained.

If it’s so big, why is there so little fuss?

The Eyjafjallajökull eruption closed European airspace and cost billions of Euros. This eruption is much bigger, but so far only Keflavik airport (Iceland) is closed and the story is beneath the groundbreaking “Footballer Has Affair” on the BBC front page. The difference in impact on aviation comes down to three factors: the ash being produced by the eruption, the weather patterns blowing the ash around, and new rules about planes flying into ash.

  1. Fine ash grains fall to the ground much more slowly than big ones, so the distal impacts of an eruption depend on how much fine ash it produces.  The proportion of fine ash depends on the composition of the magma, and if it interacts with water (e.g. from a glacier).   The Eyjafjallajökull eruption involved sticky, bubbly magma, more than 90% of which formed grains less than 1 mm across.  It was explosive when it melted through the glacier, but also once the interaction with meltwater had ended.  By contrast, Grimsvötn usually erupts basalt magma, which is rarely explosive by itself and is only explosive now because of the meltwater.  The fragmentation is less efficient and the proportion of fine ash is lower.
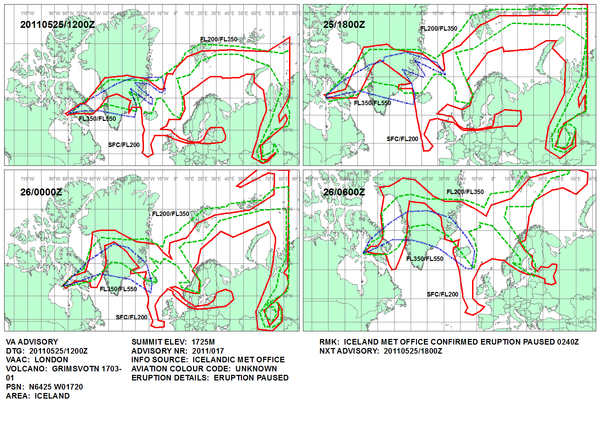
  2. During the Eyjafjallajökull eruption, there was a high pressure system over the north Atlantic whose northwesterly winds brought the ash right down into Europe.  For the moment, the winds are sending the bulk of the ash northwards into the Arctic.   The plot produced by the UK Met Office shows the predicted ash dispersion until Monday morning.

    Predicted ash distribution map from the Met Office. 22 May 2011.

  3. Prior to the Eyjafjallajökull eruption, the rules were that aviation had to AVOID ALL ASH.  Now they are different, and where planes can fly is based on zones of different ash concentration.  There are real issues with whether we are actually  able to measure/estimate the boundaries of these zones with real confidence, but the upshot is that even if we had an exact repeat of the Eyjafjallajökull 2010 eruption, the disruption to air travel would be a fraction of what we saw last year.

So my flight on Wednesday morning will be fine, then?

<<WARNING: SPECULATION AHEAD>>

Not necessarily.  Most recent Grimsvötn eruptions have lasted a few days to a week.  The most recent one, in 2004, lasted 4 days and erupted the bulk of its ash in the first 36 hours.  The Met Office surface pressure chart shows the wind moving to the northwest from Tuesday.

An individual grain of fine ash (<63 microns in diameter), falling from 17 km, can travel 1000 km before it lands, which would take it safely into Scotland.  Although Grimsvötn is producing relatively little fine ash proportionally, the much larger eruption rate means that it is still producing a significant amount overall.  If the eruption continues, then I wouldn’t be surprised if there were UK airport closures.

We’ll see what happens…

What about local effects?

Iceland is a country about the size of Ireland.  For 9 months of the year, you cannot cross the middle as the roads are blocked by snow.  Highway 1 is the tarmac ring-road that runs around the country near the coast.  The authorities have closed this where it crosses the Skeidarasandur outwash plain in anticipation of a jökulhlaup (glacial flood) when the meltwater escapes the glacier.  This means that you can no longer drive directly from Vík in the south, to Höfn in the south east (271 km, about 3 hours).  Instead, you have to go all the way round the other way (1068 km, about 13 hours).  If the jökulhlaup damages the bridges, then the road could be closed for weeks.  Nightmare!

Closer to the volcano, the ash is falling fast.  Locals have been told to bring in their livestock and to wear dustmasks and goggles.

Where can I find out more?

http://en.wikipedia.org/wiki/J%C3%B6kulhlaup

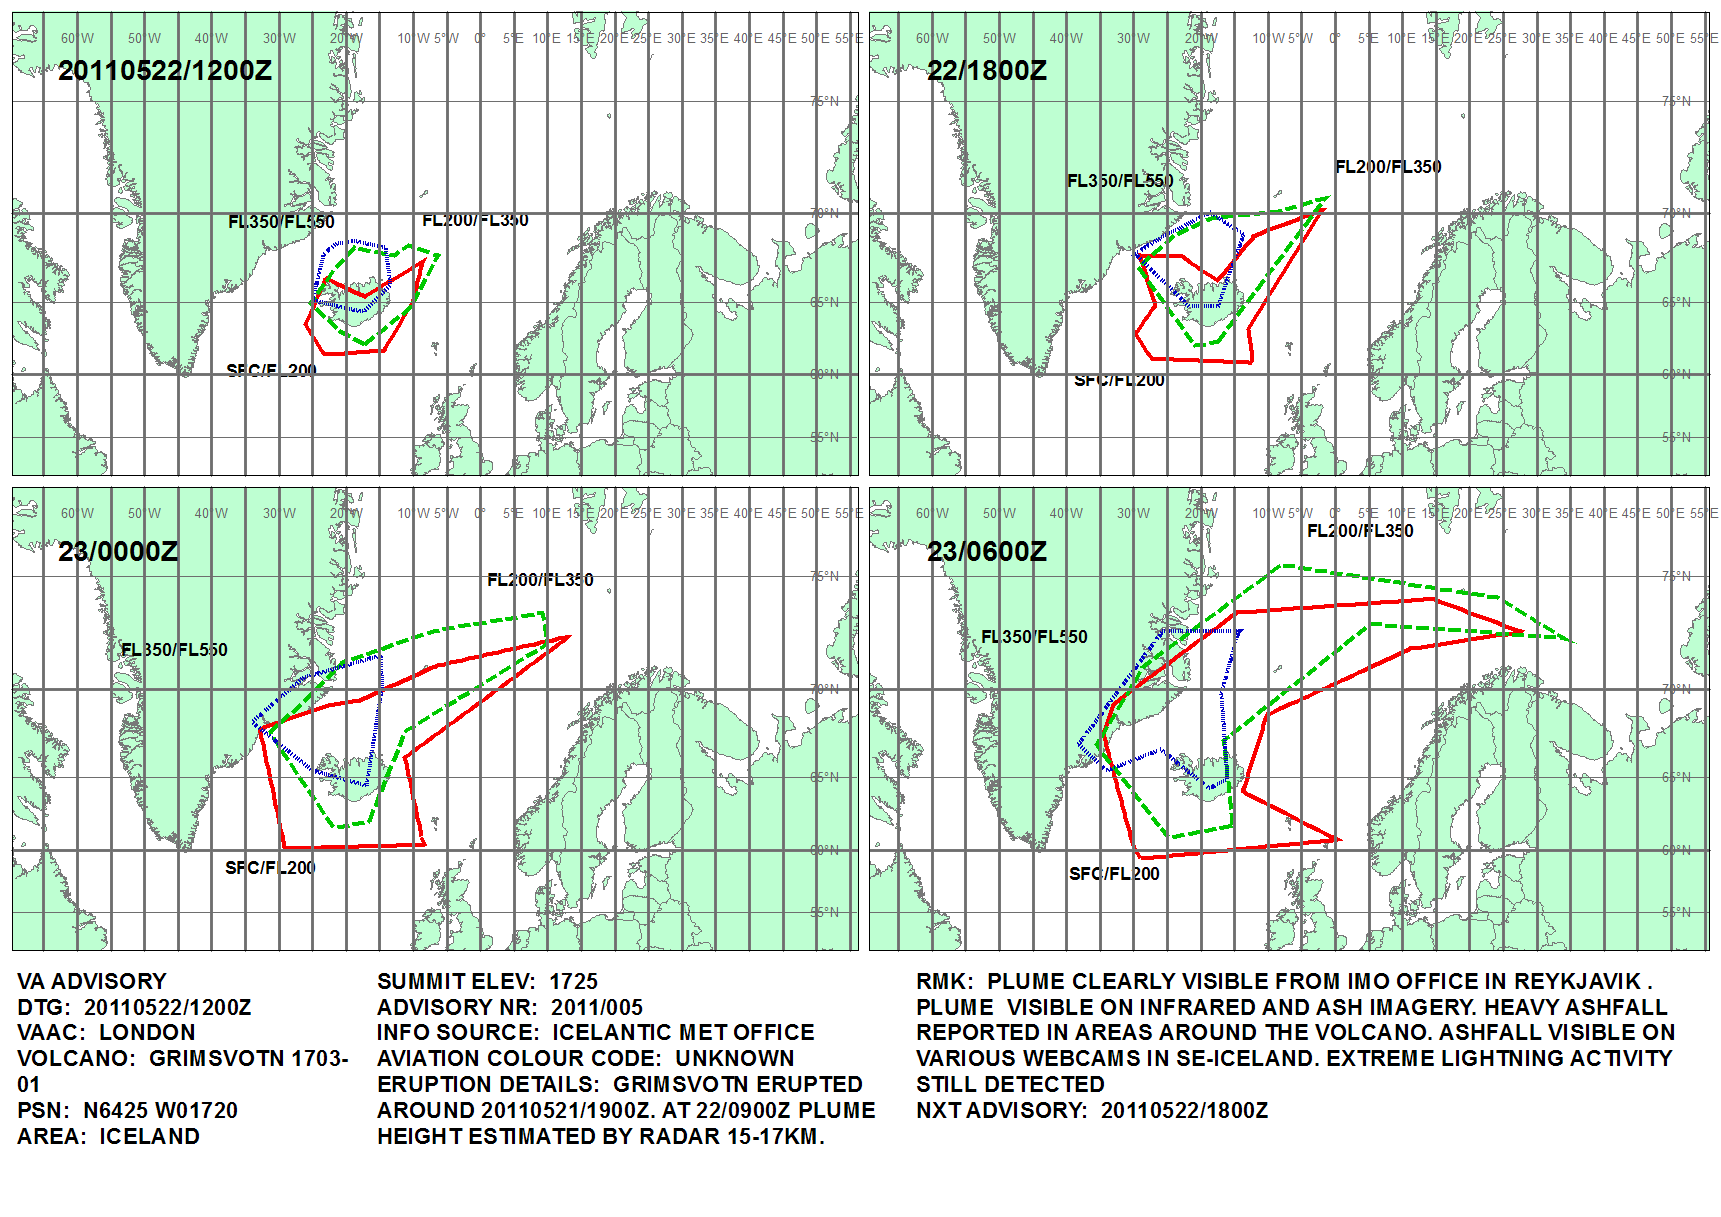
  1. The Met Office VAAC prediction of the Grimsvötn plume location 22 May 2011

Categories: Uncategorized

Metric babies

My friends had a baby today.  Congratulations to them!  And congratulations especially to Dave, for announcing the baby’s mass in kilograms.  I can’t understand why society insists that baby announcements should always be in outdated imperial measurements.

Sensible people use the metric system (or SI units, after the full French title: Système international d’unités) because it is far superior, and it is superior for two very good reasons:

  1. The base units are defined by specific quantities are always the same, no matter who measures them, or where, or when.  (Except, crucially, the kilogram.)
  2. The larger and smaller versions are all related by multiples of 10, allowing for easy conversion.  It’s easy to convert 1.234 kg to grams, but how many ounces are in 12 stone 6?

“Yeah, but they’re so easy to visualise”, people say, “and metric numbers are so cold and clinical”.  What a load of woolly nonsense!  Whose foot?  Which stone?   And where is the problem with visualisation?  Try this on for size:

Baby Zoë was born at 583144929491543703900 +/- 275778953100 periods of the transition between the two hyperfine levels of the ground state of the caesium 133 atom since an arbitrary datum chosen by medieval monks.  She has a mass of 3.24 times the mass of a cylinder of platinum-iridium alloy stored in a lab outside Paris.  Mother and baby both have heart-rate, blood pressure and temperature within one standard deviation of the mean of their cohort.

See?  Much better!

Categories: Uncategorized

Eyjafjallajökull anniversary: what we have learned

A year ago today, the summit eruption of Eyjafjallajökull began, producing a large ash cloud that wreaked havoc with aviation.  Last week, at the European Geosciences Union conference, scientists presented the results of their studies into how it all happened.  This post summarises the results of a number of these presentations.  In particular, it highlights the difficulties in trying to measure or to predict the location of such an ash cloud.

Anatomy of an eruption

The range of observations, made by hundred of scientists from tens of countries, the were presented at the conference was extremely impressive.  Through their talks and posters, we heard how each had worked away investigating their own tiny aspect of the eruption, allowing us a much greater understanding of the whole.

Seismologists tracked the magma rising beneath the volcano by locating the thousands of small earthquakes that it produced as it broke through the rock.  Radar satellites and GPS networks measured how the volcano swelled up before, and then deflated during the eruption.  The patterns were best explained by magma collecting at specific locations within the crust, especially at 4-6 km depth.  Studies of mineral chemistry revealed that these depths corresponded to the pressures at which many crystals grew, and analysis of little packets of melt that were trapped within the crystals tells us how much gas (e.g. carbon dioxide, sulphur dioxide) the magma contained down there.

Beneath Eyjafjallajokull

This image, prepared by Páll Einarsson and posted during the eruption on the University of Iceland website, shows an early interpretation of what happened beneath the volcano. Over the last year, the picture has been refined with more samples and better data. The general picture is that the Fimmvörðuháls eruption was magma that rose relatively directly to the surface, whilst the summit magmas had mingled with older magma beneath the volcano, making them sticky and producing a more explosive eruption.

On the surface, a team armed with ultraviolet cameras and various spectrometers measured how much gas was escaping from the vent (CO2; levels were equivalent to 0.5% of mankind’s daily output).  Other teams were busy mapping the thickness of deposits, and measuring how quickly the ash was falling, using radar or high-speed cameras.  Samples were sieved to find the size-distribution of erupted ash, and examined by electron microscope to see how the magma had fragmented.  The content of fluoride, which can poison livestock, and cristobalite, which has been associated with lung disease, were measured and both were relatively low.

Investigating the plume

A number of presentations were devoted to measurements of the ash cloud.  They showed the different methods that could be used to study it, and showed that each have advantages and disadvantages.

Plume size at source

The height of the plume at the source was measured by weather radar in Keflavik and by webcams closer to the volcano, and during explosive phases of the eruption, it was found to range from 6-9 km in height.  Keflavik is 150 km away from the volcano, so it is hard to pin down changes of less than ~1 km.  The sensitivity is reduced if the plume is dry, or is blowing away from from the station (i.e. towards Europe).  Webcams closer to the volcano are more precise, but are obviously useless if it is cloudy or dark.  Furthermore, it can sometimes be hard to distinguish between plumes of ash and plumes of steam.  Generally, webcam data and radar data agreed within +/-500 m, which is reasonable but, as we will see, any error in the plume height has a strong effect on predictions of ash cloud concentration.

Long distance tracking

Satellite data was used to track the plume across the Atlantic.  Visible light images (e.g. photographs) could show areas of high ash concentration, but only during daylight hours and if the ash was above the clouds.  Ultraviolet images are able to pick out sulphur dioxide, but it is unclear whether it can travel separately from the ash.  Thermal infrared (TIR) images are useful, because they contain information about both the extent and the altitude of the ash cloud.  If you assume that the ash has the same temperature as the surrounding air (which is reasonable given the small size of the grains), and we know how the temperature of air changes with altitude, then you can work out its altitude from its temperature.  This method falls down, however, if there are clouds at similar altitudes in the area, as they will also emit thermal infrared.

Using lasers in space (LiDAR), the altitude of the cloud could be checked, and the thickness could be measured.  It was found that the TIR methods underestimated the altitude of the ash by up to 1.5 km.  The thickness was usually <1 km.  Using a combination of TIR and lasers in space, the mass of ash in the cloud was estimated, but the uncertainties were around 40-50%.  Ground based lasers were also able to measure the height and thickness of the cloud, and gave confirmation of ash above a number of locations across continental Europe.  The disadvantage of LiDAR is that it can’t see through cloud, and only gives information at a specific point (or along a narrow track in the case of a satellite-based system).

Samples of ash from continental Europe
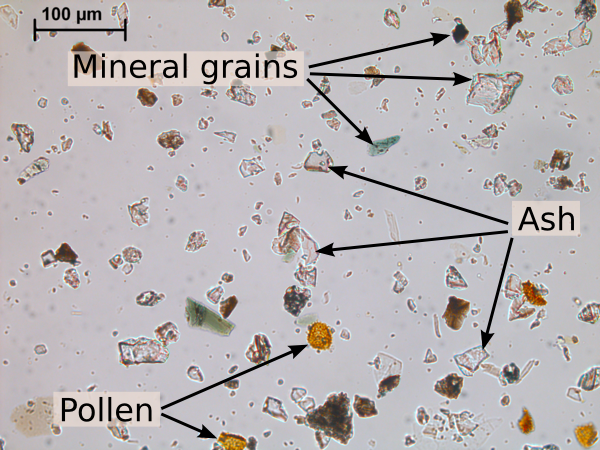
Ash grains in UK rainwater

Ash grains found in UK rainwater. The mean diameter of the grains is 20 microns. This is much larger than the grains that are assumed to make up the majority of the material in the ash cloud.

Finally, the ash in the plume was sampled.  Specially-equipped aeroplanes flew scientific missions through the cloud, filtering the air to collect ash.  By spiralling up and down through it, they were able to identify discrete layers.  Some of the planes were subsequently grounded for repair.  One study found that visible ash in the satellite images corresponded to about 3 milligrams per cubic metre (mg m-3).  Concentrations were >2 mg m-3 just south of Iceland, dropping to <0.2 mg m-3 over Germany, where the cloud was patchy and ash was mostly between 2.5 and 10 microns in diameter.  There are 1000 microns in a millimetre; these grains are seriously tiny.  Interestingly, ash grains collected on the ground were much bigger, with diameters of 40 microns in the Faroe islands and 20 microns in the UK.  Much further south, scientists measuring air quality at the Jungfraujoch weather station, high in the Swiss Alps, identified ash grains in their filters.  All of the grains had diameters of less than 10 microns.

The difficulties with dispersion modelling

During last year’s crisis, NAME, the UK Met Office’s atmospheric dispersion model was used to predict locations where ash was likely to be found.  There were a few presentations on the results.  Dispersion models have the advantage that they can predict the location of ash at much lower concentrations than can be seen by satellites, and at any time of the day or night.  The disadvantage is that their results, like those of any other computer program, are only as good as the data that is put in.

In this case, the inputs are the plume characteristics, and the weather data.  In terms of the plume, the most important factor is the mass discharge rate (i.e. how much ash comes out of the volcano per second).  Good predictions depend on being able to estimate this and feed it into the model as the eruption progresses.  Unfortunately, this isn’t that easy.
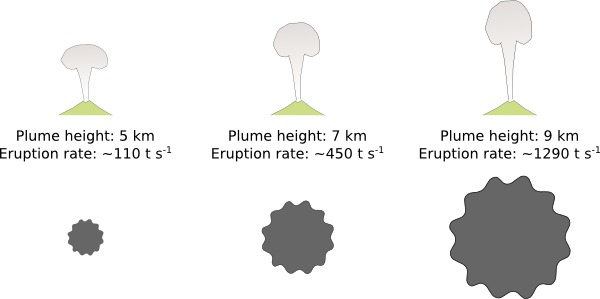
Eruption plume height versus mass discharge rate

A comparison of mass discharge rates estimated from different plume heights. The estimated mass discharge rate (given in tonnes per second) is very sensitive to the height of the plume. The area of each cloud in the diagram is proportional to the mass discharge rate.

The mass discharge rate is commonly estimated using an equation based on the height of the plume.  The equation has been derived from observations of previous, sustained, explosive eruptions.  It is not even clear how well it can be applied to Eyjafjallajökull, whose plume was relatively weak and pulsating.  Using the formula, a small error in the plume height causes a huge change in the estimated mass discharge rate.  For example, using 5 km instead of 6 km produces a discharge of 110 tonnes per second instead of 240 tons per second.  You will remember from before that +/-1 km is about as close as we can get with the radar estimates of the plume height.

This makes it very hard to put a figure on what the ash concentration might be at any one point.  One presentation at EGU compared NAME’s predictions with much of the ash cloud data described above.  It found that about two thirds of the measured values were within +/-3 times the value predicted by the model.  The errors showed no bias, so the model was not systematically under- or over-estimating the ash concentrations.
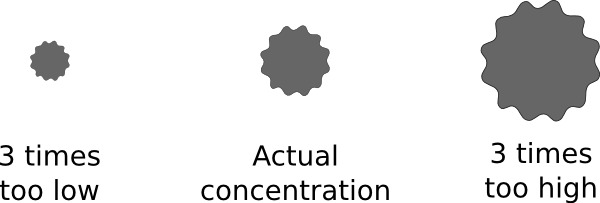
Illustration of +/3x variation in concentration.

Graphic illustration of a +/- 3 times variation in concentration. The area of the cloud is proportional to the concentration.

How much ash is too much ash?

Prior to Eyjafjallajökull, the rules for aircraft were to “Avoid All Ash”.  These were rethought in a hurry as the costs of grounding thousands of aircraft rapidly escalated.  New rules were introduced for Europe, which set a threshold concentration of 2 mg m-3, below which it was permitted to fly.  This immediately opened up large areas of airspace, allowing flights to resume.  These rules have since evolved, resulting in the designation of Areas of Low (0.2-2 mg m-3), Medium (2-4 mg m-3) and High (greater than 4 mg m-3) Contamination.  Areas of High Contamination are considered a Temporary Danger Area and special procedures must be followed if a flight is to enter them.  This is much more flexible than the previous system, but currently, with such large uncertainties in our measurements and predictions, I’m not convinced that we can distinguish regions of 2 mg m-3 from those of 4 mg m-3 with any certainty.

At the time, there were very few figures on what concentration of ash represented a danger to an aircraft.  It seems like this situation is improving now.  Experiments are ongoing, and we heard one presentation describing experiments on melting ash at jet engine temperatures.  Another talk described using NAME to estimate what the ash concentration had been during previous documented ash-aircraft encounters.  There are huge uncertainties in the results (weather recording and volcano monitoring have come along way in the past 30 years), but it seems that concentrations of a few grams per cubic metre (i.e. hundreds of times the current limit) were involved in incidents where engines were stopped.
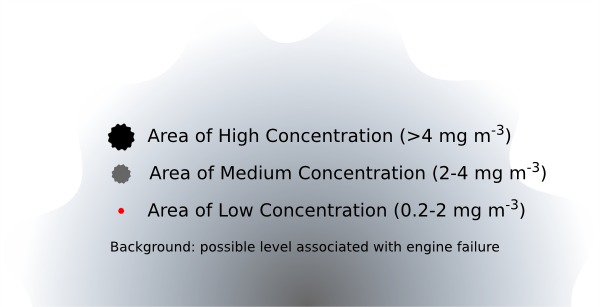
A comparison of the threshold levels of ash concentration in the new flight safety rules. The area of the cloud is proportional to the concentration.

Shoulders of Giants or Mountains of Midgets?

This post has highlighted a lot of the uncertainties and problems in the results that were presented.  This is not a criticism of the scientists.  The large uncertainties exist because they are trying to do new things, and because the things that they are trying to do are hard.

I was very impressed at how much of the data I had seen already, as lots of the results were made public very quickly during the eruption.  One year later, they are up for discussion at a conference.  Over the next months they will be submitted to journals and go through the peer-review process.  Perhaps you will be able to read the articles before Eyjafjallajökull’s second birthday.

It was also really cool to see so many different studies presented together in one place.  Newton said “If I have seen further, it was because I was standing on the shoulders of giants”.  It was such a cool line that Oasis named their worst album after it.  An alternative view, which gives a more incremental and dispersed view of scientific progress is that we stand on a mountain of midgets.  Seeing all the pieces fitting together last week suggests that this is a much more fitting description.

Sources

Most of the numbers in this post came from presentations at the 2011 EGU conference in Vienna.  Their accuracy is as good as my note-taking on the day.

EDIT: 15/04/11 15:48hrs. Fixed can/cannot typo.

Categories: Uncategorized

Ash cloud closes UK airports: what are the chances?

Quite high, actually.

And I’m not just talking from a geologist’s perspective, where the planets whizz around the sun, the continents glide across the surface of the Earth, and volcanoes pop off continuously, like bubbles in a simmering stew.  A fairly simple analysis of the frequency of Icelandic eruptions and the direction that the wind blows across the Atlantic shows that you could expect ash clouds over UK airports every few decades.

Just how active is Iceland?

It is clear that Iceland is a very volcanically active country.  Since the turn of the century, we have seen eruptions from Hekla (2000), Grímsvötn (2004) and Eyjafjallajökull (2010).  Notable eruptions of the last century include Gjálp/Grímsvötn (1996) which melted through the Vatnajökull icecap and caused a large flood (called a jökulhlaup), Eldfell/Heimæy (1973) where the townsfolk sprayed seawater on the lava flow in an attempt to divert it, and Surtsey (1963-67) when a new island was born out of the north Atlantic.  But can you put a number on it?

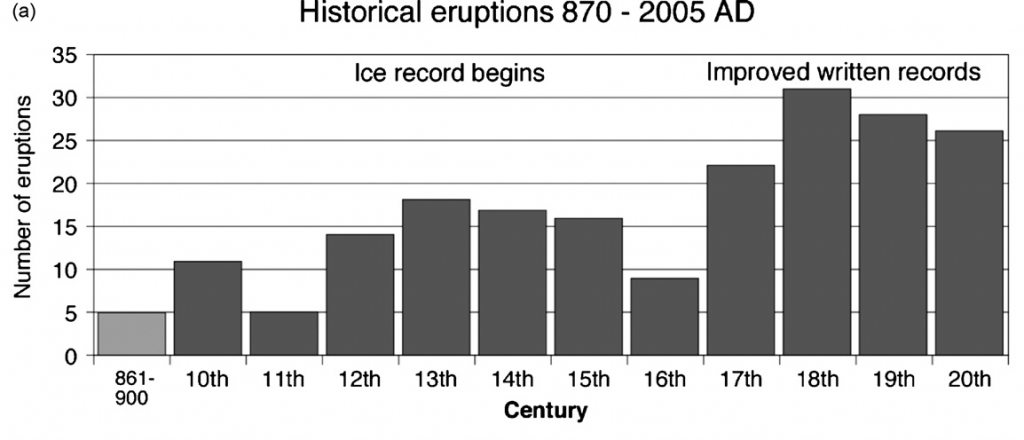
Fortunately, Icelanders are an extremely literate people, and their sagas and other writings are full of descriptions of “Earth fires”.  These date right back to an eruption seen by the first settlers around 930 A.D.  Studies of this literature, combined with field explorations to confirm that the deposits exist, find about 200 eruptions in the last 11 centuries.  Of those, ~155 were explosive, and ash grains from at least 16 of them have been found outside of Iceland, in soils and lakes across northern Europe.

Icelandic eruptions in historic time - Thordarson and Larsen (2006)

A similar eruption rate is found by studies looking at the past ~10,000 years.  This period coincides with the time since the last ice age, and is referred to by geologists as the Holocene.  Holocene eruptions can be counted by looking at lava flows and ash layers that have not been affected by glaciers, and we can work out when they formed using techniques such as carbon dating.  So far ~2,400 eruptions have been identified, although ~500 of those didn’t produce much ash.

So both the historic and the Holocene records suggest that there are eruptions in Iceland about once every 5 years, and that about three-quarters of those produce ash.

Any way the wind blows

To understand the risk that these eruptions present to UK airports, we need to ask the question: “What proportion of the time will ash from these eruptions reach the UK?”  A recently-published study by scientists at the UK Met Office provides our current best answer.

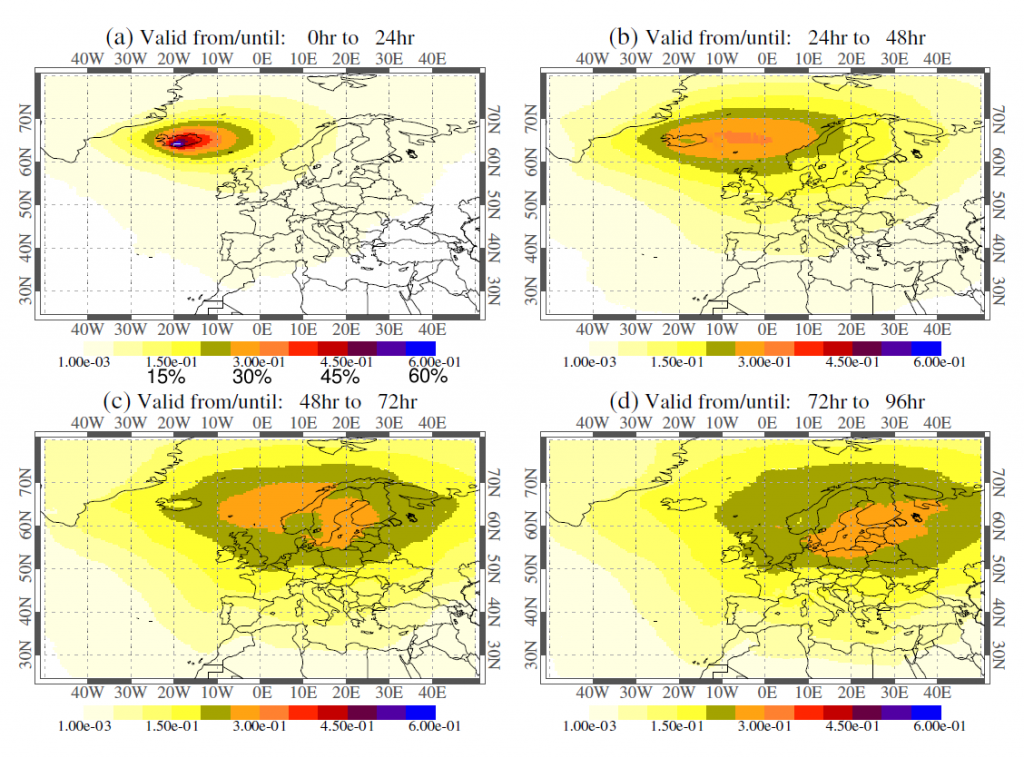
Using their NAME software (more on this in future posts) they simulated 17,000 eruptions of Hekla volcano, one every 3 hours from 1 Jan 2003 to 31 Dec 2008, using the actual weather data from the time.  NAME is a computer model for atmospheric dispersal that predicts where ash grains are blown and dispersed by the wind, and is the one used by the London Volcanic Ash Advisory Centre to work out areas where aircraft might encounter ash.  In each simulation the ash was erupted in a 12 km-high plume, at a rate equivalent to 2,400 tonnes per second, for 3 hours, then tracked over the following 4 days.  An area was deemed ‘affected’ if the predicted concentration exceeded a certain threshold (equivalent to ~0.05 milligrams per cubic metre).

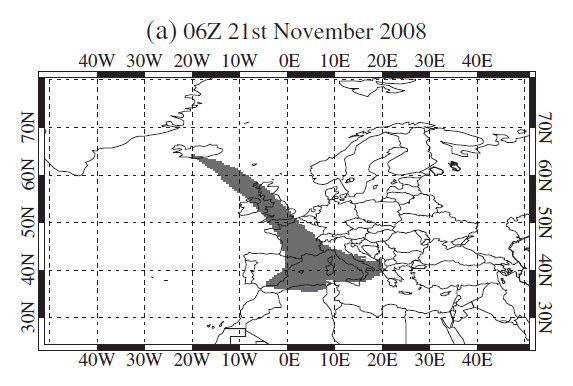
Probability of ash concentration exceeding threshold between surface and ~6000 m (20,000ft) - Leadbetter and Hort (2011)

The results of each eruption were added together to make maps of the probability of an area being affected by ash during different time periods following the eruption.  Most of Europe above 50°N has a probability of at least 20% of being affected within 4 days.  The results show the track of the “average” plume, reaching the North Atlantic (after up to ~24 hrs), then Scotland and Scandinavia (~48 hrs), followed by Western Europe and the Baltic sea (~72 hrs), and finally reaching Eastern Europe and Russia (~96 hrs).

Of course the average tends to smooth things out.  If doorways were built according to the average height, there would be a lot of banged heads!  Individual scenarios, such as the one below, give a more realistic representation of the ash cloud shape.  This example, where the winds blow the ash cloud directly towards the UK in less than 24 hours, has a 5-15% probability.  Prior to Eyjafjallajökull, the last eruption to do this was Hekla 1947.  You never hear about disruption to flights on that occasion because it was years before the commercial aviation industry had really … taken off.

Region where ash concentration exceeds threshold within 24 hours following individual eruption - Leadbetter and Hort (2010)

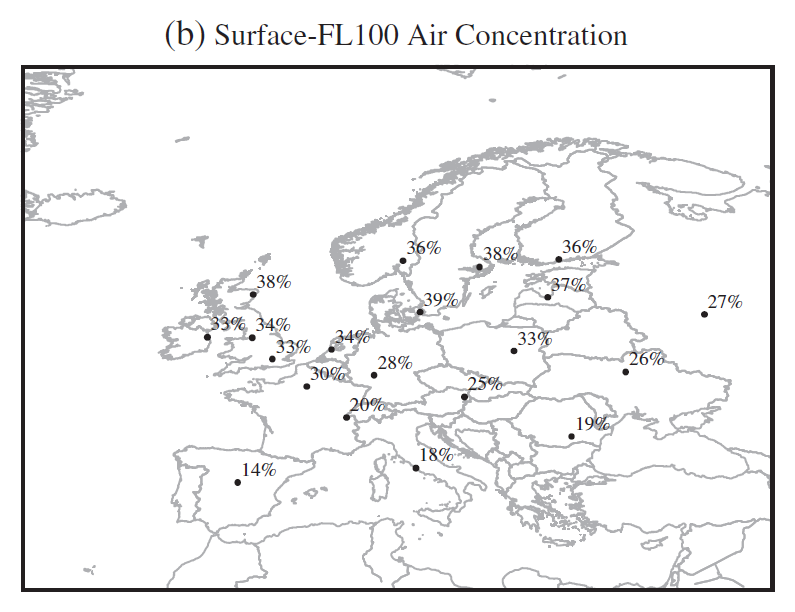
Finally, they plotted the probability of 20 different European airports being affected by ash in the 4 days following the eruption.  As expected, Scotland and Scandinavia come off worst, and it seems that all of the UK has about a 1 in 3 chance of being affected by a Hekla eruption of this type.

Probability that ash concentration exceeds threshold within 4 days of eruption at various European airports - Leadbetter and Hort (2011)

Volcano roulette

Combining the numbers above, we can estimate the probability of an eruption affecting UK airports in any given year.  But before doing so, there are a number of factors to consider.  The most important are:

  • Not all eruptions are equal.  Icelandic eruptions can vary in size, duration and the amount of ash produced.  For example, the Eyjafjallajökull eruption had a lower plume (~9 km) and eruption rate, but lasted much longer (~4 days for initial explosive phase) than the Hekla eruption here.  All these factors will affect the risk to the UK.
  • The Met Office study was carried out before the Eyjafjallajökull eruption, when the advice for aircraft was to avoid all ash.  This was good advice; the United States Geological Survey recently found that ~20% of reported aircraft-ash encounters since 1953 had resulted in engine damage or failure.  Since 2010, a new threshold of 2 milligrams per cubic metre has been introduced.  This is higher than the threshold used in the study, so it is less likely to be exceeded.

These factors add uncertainty to any calculations, which currently provide only a rough estimate of the probability of a UK airport being affected by ash from an Icelandic eruption in any given year.  The probability is calculated as:

P = chance of eruption (1/5) x proportion of eruptions that produce ash (3/4) x probability of ash reaching the UK (1/3) = 1/20

Taking into account the uncertainty added by the factors above, it is fair to say that we can expect airport closures about every few decades.  This is quite a simplistic calculation, but the take-home message is that this is not just a once-in-a-millenium, or even a once-per-century event.  Consequently, it is something that we should be planning for and working hard to understand.

Thanks

This is the first post at volcan01010, and the combination of Iceland, volcanoes and computing is a good taster of things to come.  I’d like to thank Chris and Anne at all-geo.org for hosting this blog and giving me somewhere to write it!

Categories: Uncategorized