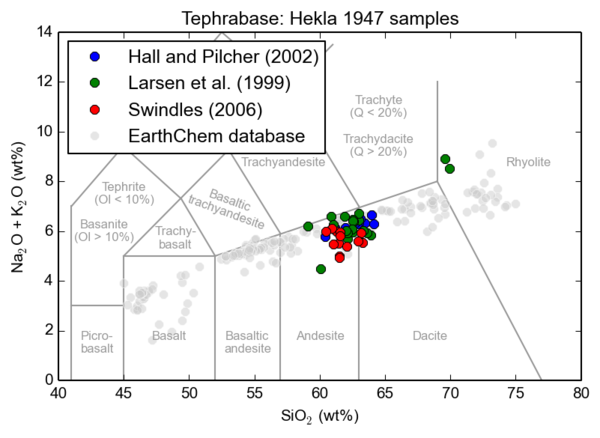
I recently made a total alkali vs silica (TAS) plot to compare the magma of the Hekla 1947 eruption with the compositions of magmas from previous eruptions. This post contains the code to draw the plot, including a module that draws the different compositional regions for you.
Total alkali vs silica plots
Volcanic rocks have a range of compositions, and consequently a range of properties. The most important measure is the proportion of silica (SiO2). Low-silica magmas such as basalt are more dense, have high melting points and form less-viscous (i.e. more runny) melts than high-silica magmas such as rhyolite. Eruptions of andesite magma or higher are more likely to explosive and pumice-forming as pressurised gases struggle to escape from the sticky magmas. Magmas that are rich in alkali metals (Na, K) are typically less-viscous and crystallise slightly different minerals to the lower-alkali compositions.
TAS plots are a graphical representation of the silica and alkali contents of a magma. The regions on this TAS plot are named with familiar (and unfamiliar) magma types and were defined in a report by Le Maitre et al. (2002). The TAS classification page on Wikipedia has more information and links to their individual pages.

Example total alkali versus silica plot with the different compositional fields marked. The plot compares tephra from the Hekla 1947 eruption found in the UK (Hall and Pilcher 2002; Swindles 2006) with in Iceland (Larsen et al. 1999) and other eruptions from Hekla volcano. Click to enlarge.
The plot shows that the Hekla 1947 eruption was dacite-andesite in composition. As you might expect for this composition, it began explosively (showering southern Iceland with pumice and ash for a few hours) before going on to produce lava flows for over a year. The data were downloaded from Tephrabase and EarthChem databases, respectively.
tasplot.py
The following code was used to draw the TAS plot above. I wrote a module, called tasplot, with the code that draws and labels the fields via the add_LeMaitre_fields() function. All the other commands are typical for plotting with Python and Matplotlib.
Follow the instructions on the BitBucket repository page at https://bitbucket.org/jsteven5/tasplot to install. You can browse the source code of tasplot.py directly by clicking here.
# Import plotting modules
import matplotlib.pyplot as plt
import tasplot  # This imports the tasplot module

# Set up figure
fig = plt.figure()  # create figure
ax1 = plt.subplot(111)  # create axes and store as variable
tasplot.add_LeMaitre_fields(ax1)  # add TAS fields to plot

# Note that you can change the default colour and font size e.g.
# >>> tasplot.add_LeMaitre_Fields(ax1, color='red', fontsize=8)

# Plot the data (from pre-existing variables)
ax1.plot(hallpilcher_silica, hallpilcher_alkali, 'o', alpha=1,
         label='Hall and Pilcher (2002)')
ax1.plot(larsen_silica, larsen_alkali, 'o', alpha=1,
         label='Larsen et al. (1999)')
ax1.plot(swindles_silica, swindles_alkali, 'o', alpha=1,
         label='Swindles (2006)')
ax1.plot(earthchem_silica, earthchem_alkalis, 'o',
         color=(0.8, 0.8, 0.8), alpha=0.5, mec='white',
         label='EarthChem database', zorder=0)

# Decorate the plot
plt.xlabel(r'SiO$_2$ (wt%)')  # Use LaTeX notation for subscript
plt.ylabel(r'Na$_2$O + K$_2$O (wt%)')
plt.legend(loc='upper left', numpoints=1)
plt.title('Tephrabase: Hekla 1947 samples')
plt.savefig('Tephrabase_Hekla1947.png', dpi=150,
            bbox_inches='tight')

#


Nice! Love these sort of utilities.
Maybe I should do a ternary plot, for practice….
This is great! I was actually just yesterday making a TAS diagram in Python! Definitely going to utilise your code from now on, or a fork of that code… 😉
Thank you very much! Extremely useful utility.
This is really useful, thank you!
Traceback (most recent call last):
File “exper2_2.py”, line 16, in
ax1.plot(larsen_silica, larsen_alkali, ‘o’, alpha=1,
NameError: name ‘larsen_silica’ is not defined
I got this error… what should I do?
Forget abt this question. I just figured it out 🙂
I am trying to run the above code in jupyter notebook and getting nothing but errors. I must be doing something wrong but have tried several things with no success.
tasplot imports just fine but in the plotting section I am getting errors on all four sets of plots
NameError Traceback (most recent call last)
in ()
1 # Plot the data (from pre-existing variables)
—-> 2 ax1.plot(hallpilcher_silica, hallpilcher_alkali, ‘o’, alpha=1,
3 label=’Hall and Pilcher (2002)’)
4 ax1.plot(larsen_silica, larsen_alkali, ‘o’, alpha=1,
5 label=’Larsen et al. (1999)’)
NameError: name ‘hallpilcher_silica’ is not defined
I also tried to run the section
# Note that you can change the default colour and font size e.g.
tasplot.add_LeMaitre_Fields(ax1, color=’red’, fontsize=8)
and got the following error
AttributeError Traceback (most recent call last)
in ()
1 # Note that you can change the default colour and font size e.g.
—-> 2 tasplot.add_LeMaitre_Fields(ax1, color=’red’, fontsize=8)
AttributeError: module ‘tasplot’ has no attribute ‘add_LeMaitre_Fields’
Hi John,
The first error is because you don’t have the hallpilcher_silica variables defined. Those were my data that I used for the plot above but they don’t come with tasplot.
There is an example on the BitBucket page that defines some example data. https://bitbucket.org/jsteven5/tasplot/overview
Try that and see how you get on.
Hi John
Went to the bit bucket page and had more or less same error message
import tasplot
import matplotlib.pyplot as plt
silica = [50, 60, 70]
total_alkalis = [4, 5, 6]
fig = plt.figure()
ax1 = fig.subplot(111)
tasplot.add_LeMaitre_fields(ax1)
plt.plot(silica, total_alkalis)
AttributeError Traceback (most recent call last)
in ()
6
7 fig = plt.figure()
—-> 8 ax1 = fig.subplot(111)
9 tasplot.add_LeMaitre_fields(ax1)
10 plt.plot(silica, total_alkalis)
AttributeError: ‘Figure’ object has no attribute ‘subplot’