Sedimentology on the Moooon

I am a big fan of BBC Radio Four’s In Our Time. The format is always the same: veteran broadcaster Melvyn Bragg plus three top British academics discuss a particular topic.

It is not in the least bit dumbed down, being 45 minutes of intense talk about things like ‘The Safavid Dynasty’.  I can recommend it heartily. It’s entire 10 year archive is available on-line and is available outside of the UK too.

A recent IOT covered the moon. As a programme is was only so-so, starting badly with someone lazily describing basalt as a mineral – a real shout-at-the-radio moment. It contained some absolutely fantastic stuff though.

Why there is lots of anorthosite on the moon – The formation of the moon was discussed. I was hazily aware of the giant impact hypothesis, but hadn’t really thought through how amazing it was. Simply put, very early in the history of the solar system two bodies both smaller than the earth collide. When the ‘dust settles’ the material ends up with a large body (the earth) and a smaller one in orbit (the moon). This explains lots of odd things, such as why the moon and earth have similar isotopic compositions. What I hadn’t realised is how extraordinary the moon’s composition is. Moon rocks contain virtually no volatile elements, ones with low boiling points. This isn’t just water, this means Sodium and Potassium were ‘boiled off’ from rock involved in the impact. The heat caused by the impact caused these elements to vaporise and be lost to the moon. As the magma on the moon later cooled and crystallised plagioclase, it is anorthite, the Calcium-rich version. This explains why the moon is unusually rich in anorthosite.

Record of the early earth – The best bits of the programme came from Ian Crawford talking about the lunar soil. The surface of the moon is covered with a soil-like layer called the regolith. In the early stages of the Apollo missions there was a worry that lunar landers would sink into it. The regolith acts as a sponge, grabbing hold of whatever is flying around. The fabulous bit comes from his speculation about what might be held in there.

There is a big gap in the earth’s history. We can infer from the age of the moon (four and a half billion years old, or 4.53 Ga in geology speak) that the earth was formed at this time. For the next 500 million years we have very little evidence of what was going on, just a few mineral grains preserved in younger rocks. We believe this was a period of intense meteorite bombardment, which might help explain the fact rocks of this age are not preserved. Ian Crawford believes that precious samples of these rocks are preserved in the lunar regolith. In the same way we have lunar meteorites here on earth, material thrown up from the earth would have landed on the moon. Areas of regolith of this age are believed to exist, preserved pristine underneath lava flows.

There’s more. The sponge like regolith might contain ancient gas, escaped from the earth’s atmosphere way back in Earth history. A record of gamma-ray bursts, ancient supernovae, or clumps of interstellar dust, or the solar wind might also be preserved.  In the right area, with some form of stratigraphy of datable lava flows and regolith it would be possible to measure the pattern of these things over time.

I love the idea that the moon is a form of archive of the earth’s early history, containing evidence erased from the earth and found nowhere else. It makes the moon and earth seem more equal perhaps. Like twins with a shared traumatic early history that one has forgotten and the other remembers for them both.

A bit of me is a little sceptical as well, but Ian Crawford needs to persuade someone to fund his research so you can’t blame him for talking up all the possible angles. His is no ordinary funding problem of course, since it requires detailed field work and sampling on the moon, perhaps requiring a moon-base. Since no sane politician would propose spending money on such a thing at the moment, we may all have to wait a while to know what ancient secrets the lunar regolith is preserving.


Continental tectonics

This post is part of my journey into the geology of mountains.

Plate tectonics is one of the most successful scientific concepts of the Twentieth Century. It revolutionised the study of the Earth and is one of the few cases where the term paradigm shift can correctly be used.

The theory describes the earth in terms of a small number of rigid plates, whose motion can be described as a rotation on the surface of the earth. Plate boundaries, such as subduction zones or mid-ocean ridges are where these plates move relative to each other. For oceanic plates this description is well-nigh perfect; the zone of deformation at the plate boundary is narrow.

Continents are different. On the broad scale, no difference. The relative motion of Siberia with the lowlands of India can be described accurately by the relative movement of the two tectonic plates, with a rate of convergence of c. 60 mm/yr. Anywhere in between though, things are more complicated. There are major thrusts at the base of the Himalaya, that look like a classic plate boundary, but these only account for about a third of the convergence. The rest of the movement is distributed throughout the Himalayas and the Tibetan Plateau behind it. This can be confirmed by direct GPS measurements. California is another example of this. The strike-slip movement of the Pacific plate relative to North America is distributed across most of California, as confirmed by direct measurement.

So, if a plate boundary can cover 1000s of kilometres and classic plate tectonics does not describe what is going on in these diffuse plate boundaries, then it is not such a useful concept when studying mountain belts. This realisation led to the creation of the term continental tectonics in the 1980s.

Continental tectonics is a general term covering concepts that attempt to describe the behaviour of broad deforming areas of continental crust. So how to get a handle on this behaviour? One approach is to think about areas where the zone of deformation between plates is very wide. The best example is Tibet.

The Himalayas are not important – What’s the most remarkable geographic feature of the Tibet/Nepal area? You probably thought of Mount Everest (to use the western name) or the larger set of 14 peaks that are over 8000m in height across the Himalayan mountain belt. I disagree. The Himalayas are the more glamorous, but actually the Tibetan plateau is the more remarkable feature.

Here’s a cross section of the Himalayas, generated from Google Earth, looking east:

Impressive, most definitely, but here it is again in context.

Same general direction, but note the horizontal scale is 10x longer. The maximum height is lower, but more realistic. The first cross-section I deliberately aimed for the Everest region, trying to get a large height, for the second I just crossed the Himalaya at no particular point.

Not so impressive now. The big mountains are in the Himalayas, but on average they are just the front edge of the Tibetan Plateau. The geology of the Himalayas could be viewed as a narrow plate boundary (lots of thrusting, sequence from Indian through to Asian rocks). What is hard to explain is why the Tibetan Plateau exists at all. Even more mysterious is the fact that recent faults in Tibet are extensional! To see extensional faults, where things are pulling apart, in a large area within a major compressional zone is rather counter-intuitive.
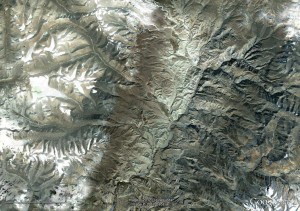
Thak Khola Graben, Mustang, Nepal.

Many Earth Scientists have tried to understand Tibet, some have turned to mathematics, some to plasticine.

The extrusion model – One approach is to say that the concept of rigid plates still applies, it just gets more complicated. So, perhaps the area between Siberia and the Indian plains is made up of a jostling series of microplates, a finite number of rigid portions of crust. Clearly on one level, this is true. The only explanations I’ve seen of the geography north of Tibet (moving north, the Tarim Basin and then the Tien Shan mountain range) rely on the crust underlying Tibet having different properties to that underlying the Tarim Basin. Simply put, Tibet is soft and gets deformed into mountains, whereas the Tarim Basin crust is strong and stays rigid. Recent evidence of subduction of Tarim Basin crust underneath Tibet supports this.

One microplate model of Tibetan Geology is inspired by physical analogue models of the India-Asia collision. Analogue models work by taking a scaled model of the crust, with similar physical properties to the crust (again scaled). The model is then deformed. This particular model the Asian plate as soft material (plasticine) and India as a rigid indentor. Critically, the eastern side of the model was left open, on the basis that the oceanic crust there does not provide any ‘resistance’. As the Indian rigid indentor was pushed into Asia (simulating the original plate collision) crust was extruded east in big flakes separated by large breaks in the material. This extrusion model is most associated with the renowned Paul Tapponier.

Look at the diagram below (source details at end of article):
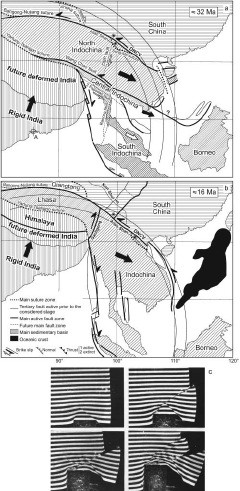
The final panel shows photos from a plasticine analogue model as described above. The first two panels are a sequence, showing how material is extruded out from Tibet into South-east Asia. This extrusion process is also consistent with extension in Tibet. The crust is being compressed on a North-South axis but is simultaneously extending East-West.

An implication of this model is that these major faults are in effect mini-plate boundaries. For the model to work these faults need to cut the entire crust and to show major (1000 km) displacement. Therefore, one way of better understanding Tibet is to do a detailed investigation of a fault in Vietnam.

Searle et al. 2006 and Searle et al. 2010 tease out the detail of deformation and metamorphism around the Red River fault. This fault (near the label DNCV in the diagram above) is near metamorphic rocks and granites. Proponents of the extrusion model propose that these rocks were formed by syn-deformational shear heating along the fault, which is therefore a major crustal structure. Searle and friends refute this by detailed structural work and by deriving a Triassic age for metamorphism (which is before India hit Asia). They interpret this fault as a structure that cross-cuts older and unrelated rocks that are not caused by shear-heating.

In fact Searle and others have, for over 10 years, been arguing against the extrusion model, using various lines of evidence to show these large faults are not micro-plate boundaries.

Continuum dynamics – So, if the extrusion model doesn’t fit the evidence, how do we explain Tibet?

Another approach is to model the behaviour of Tibet using continuum dynamics. Put crudely, this takes the micro-plate idea to its logical conclusion. If you divide a rigid plate into smaller and smaller sections ad infinitum, what do you get? If every atom is free to move independently of the rest, you get something that behaves like a fluid.

Stop! Before you click away in disgust at my madness, consider the mantle. This convects, just like a fluid, does it not? Given enough time (and high enough  temperatures) rock will act like a fluid, just a very very viscous one. Rocks on the surface of Tibet are cold and brittle, they are cut by faults, but most of the volume of the crust is deeply buried and quite hot. Continuum dynamics is an approach that models the entire crust and regards brittle structures on the surface as more symptom than cause.

Continuum dynamical approaches to continental deformation identify two drivers: external ‘boundary forces’ (rigid India colliding) and internal ‘body forces’ caused by gradients in crustal thickness. If these balance out then an equilibrium is achieved, if they don’t, then crust will flow. In the face of continued Indian convergence (associated with a force pushing India north) the crust thickens and the Tibetan plateau is created.

Continuum dynamics is most closely associated (at least in my mind) with the work of Phil England of Oxford, but the key papers involve many other big names in Geology.

Summary and next steps – So, in summary, continents don’t behave like oceanic plates. Portions of them behave like rigid micro-plates, but in areas like Tibet the crust can behave like a fluid. By modelling modern day topography and crustal surface flow (which can be directly measured via GPS), the viscosity of Tibetan crust has been estimated to be only 10-100 times more than convecting upper mantle. Our mental picture of a fluid planetary interior and a rigid crust above is too simple: sometimes even the crust behaves like a fluid.

This post is the second step of a journey to explain my pictures of Mount Everest. What lies ahead? I feel I ought to have a go at doing more justice to rheology and crustal structure as I’ve barely struck it a glancing blow here. These concepts will help us approach different and perhaps better models of Himalayan geology. Also I’m bound to get distracted along the way by some pleasing diversion or other. Stick with me as the journey will be worth it. Why?- “because it’s there“.

Declaration of Interest. Mike Searle and Phil England taught me, plus many proponents of the extrusion model are French. I’ve tried to be even-handed, I have, but do be aware of the tribal loyalties and ancient anti-gallic prejudices that are bubbling around in my subconscious.

Further reading & references

This post owes a lot to Searle et al. 2011 (doi: 10.1144/​0016-76492010-139) which helped refresh my memory and bring my knowledge up to date. I shall be returning to it in future posts as I’ve only covered a small portion of it.

Pete Molnar’s Nature paper from 1988, Continental tectonics in the aftermath of plate tectonics is an early introduction of the distinction between continental tectonics and class plate tectonics.

Searle et al. 2006 (doi:10.1144/0016-76492005-144) and Searle et al. 2010 (doi: 10.1130/GES00580.1) are specific studies arguing against the extrusion model by looking at the Red River fault., The discussion arising from the 2006 paper gives a view from proponents of the extrusion model (doi:10.1144/0016-76492007-065).

Image credits

Images taken from Google Earth. Diagram taken from Searle et al. (2011) with implicit permission of the Geological Society of London and kind permission of Prof. Mike Searle.
What Geology did to me #1 – beard

I’m a metageologist, trained as a geologist but cast adrift amongst normal folk. I sometimes notice ways in which I’ve been marked by that training. Some are trivial, some not so much. I feel the need for a theme of quick whimsical posts so I’m going to talk about them a bit. Here goes…

Geologists like beer and have beards. It’s a cliché, but has a lot of truth to it; it certainly applies to me. I’m from the north of England so the beer thing came naturally (my dad buying me discrete half-pints in the pub from the age of 14). My beard I grew as an undergraduate studying Earth Sciences, so we can call this something Geology did to me.

Why did I grow my beard? Well, there were a lot of role models with beards – a good proportion of the teaching staff were beardies. My college tutor sported a fine specimen, wispy and slightly crazed. It definitely told you this man did a lot of fieldwork in Greenland; you weren’t surprised that he seemed to positively enjoy not washing during two months in the wilderness. Even some geophysicists, people ignorant of the pleasures of letting yourself go when in the field, were bearded, albeit they had neat goatee beards.

Why geologists and beards? Well, they are in keeping with the scruffy-chic cultivated by academics and people who don’t work in an office. Wearing a suit in my Geology department was definitely a sign of low status, marking you as a supplicant, looking for a job or selling something. Conversely taking no interest in your appearance marked you out as someone with no need to impress others. Not shaving fitted nicely into this.

Fieldwork is of course another excuse. It fits in with my beard’s birth, a rather fabulous summer of Geology where I stopped shaving as it ‘would have been too much trouble’. First I spent six weeks in Ireland doing my undergraduate mapping project. Next a month trekking in the Indian Himalaya, passing past Gumbarajon in Zanskar where the equivalent area of granite I’d laboriously mapped in Ireland was gloriously displayed in a massive vertical rock face. As well as the usual Indian tourist illnesses I discovered I had an allergy to my malaria pills which meant I didn’t eat for a fortnight while walking in the Himalayas. If you are looking for a weight loss programme, this I can recommend.

For the last event of this summer I arrived in Switzerland for an undergraduate field trip so fantastic that it was never run again due to excessive cost. I was not recognised by some fellow students, since as well as burning off my puppy fat, I had grown a beard. I found the contrast of the Himalayas with the Alps very stark. I really disliked the Alps as too tidy, too neat, too Gemütlich compared with the ramshackle majesty of the Himalayas. Switzerland consisted of neatly scrubbed rocks, above some manicured grass with cows, each with their own cute bell, with a public infrastructure that made England’s look shabby and chaotic. I hated it and took perhaps too much pleasure in being forced to dive behind trees and leave little bacterial mementos of my trip to India. Perhaps I was inspired by the shaggy majesty that now hung from my chin.

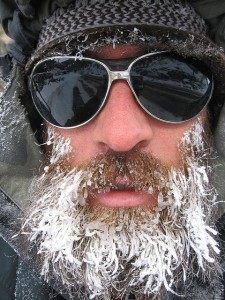
I still have a beard, as you can see from the photo to the right of here. It is slightly grizzled now, also a lot neater; trimmed and shaped, fit for the office. In my minds-eye though it really looks like this:

From Richard Thompson on Flickr. Used under Creative Commons via eng.letscc.net

UPDATED: Copyright, blogging and scientific papers

Is it legitimate to reproduce diagrams from scientific papers in a blog post? Curious, I asked the question of Twitter. It returned two distinct responses.

One response, from a pair of scientists and highly respected and active bloggers was (to simplify and paraphrase) that it was OK since you were discussing Science. Asking permission of the author was the polite thing to do, but ask the publisher only if you get the material direct from their website.

Another response, from a professional archivist and soon-to-be-published book author was a clear statement of the legal situation: it would be a clear breach of copyright, not covered by ‘fair use’.

Both sets of responses entirely correct, but reflecting two ways of viewing the situation. Copyright is an important legal protection for content-creators and should be respected (and is The Law), but equally communication of scientific ideas is an important public good. An interesting contrast, which I thinks maps nicely onto a growing discontent with academic publishers. Academics are the creators of the content, yet the Copyright is held by the publisher. When journals were distributed in paper form, the value added by the publisher was clear. Now that online access is the norm, and authors submit formatted papers and when scientific editing and refereeing is also done by academics, the value added by publishers is less clear. When even the Economist talks of ‘fat profits’, it seems the balance is skewed.

So, what’s a boy to do? Well, I happen to belong to the Geological Society of London and the particular diagram I am dying to copy is in their journal. A quick and helpful twitter response from them pointed me to their publications permissions page. All is well! With acknowledgement, I can use up to three figures without permission and up to 100 words. [NB this implies a picture only paints 33 words, surely wrong?].

This gave me a warm glow, since this seems to be a nice balance between the need for protection of copyright and the fact that “data wants to be free”. A search of a commercial publisher soon deadened the glow. Elsevier have a process whereby I can request permission to use content. Selecting a random Earth Sciences paper and requesting to put a single image on the web, for non-commercial use would cost me $28.75. How much of this is given to the person who created the diagram? None, of course.

Following the equivalent process with Nature Publishing (who use the same RightsLink software) cheered me up again as using figures for non-profit is free.

The roller-coaster continues down again, as it appears that the Geological Society of America does not allow posting material on the web unless you are the author. You can request permission, but this costs $10 for processing. Also they haven’t responded to my tweet yet. UPDATE: Those lovely people at the Geological Society of America have responded to my tweet. In a very rapid response to this post and a related post from Brian Romans (@clasticdetritus) they have revised their policy to say that using a single image/table/paragraph counts as ‘fair use’ and does not require permission. I feel inspired to go off blog about a paper from one their journals now, by way of thanks.

Anyway, I am beginning to bore myself. I shall be off and send an email to the author, whose paper in the JGS I covet.

Disclaimer: I don’t really know what I’m talking about. If you wish to do be certain about copyright law, don’t take my word for it. Opinions expressed here are not those of the author, past blog post quality is no guide to future performance, may contain nuts.