The town eaten by the sea

Some towns have all the luck. A thousand years ago Southwold, in Suffolk on England’s east cost, was a fishing village dwarfed by Dunwich, a major port town to its south. Nowadays Southwold is a thriving seaside town and Dunwich is just a few houses, one pub and a museum. Its priory, leper hospital and over 8 churches are all gone – swallowed by the sea.
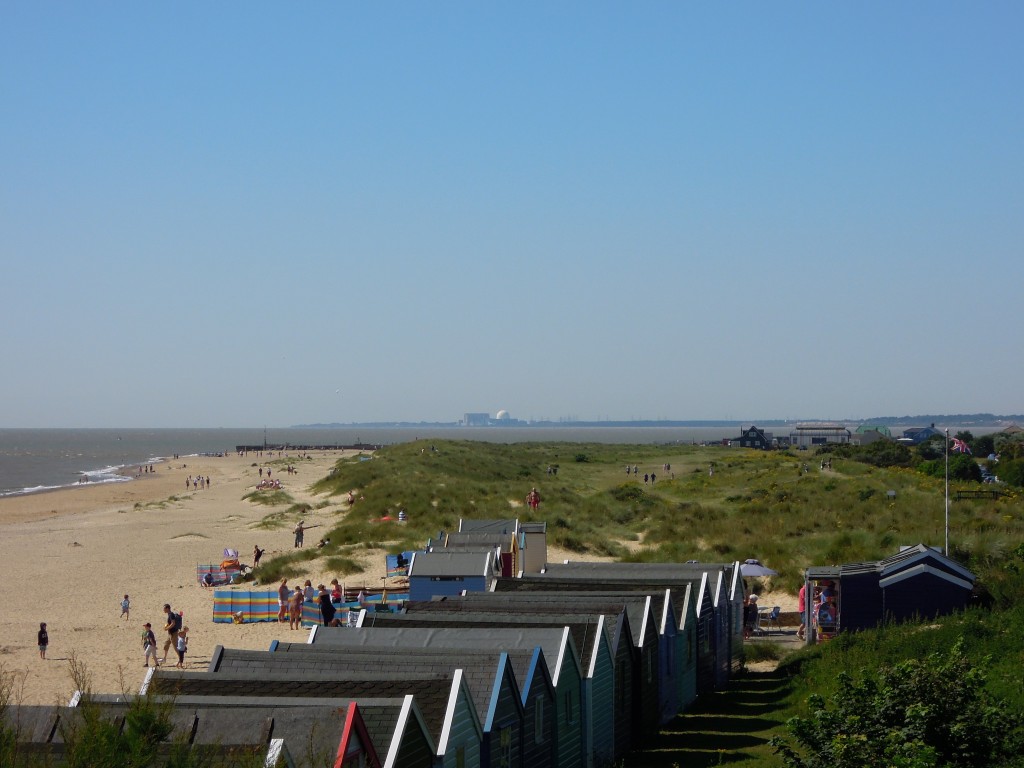
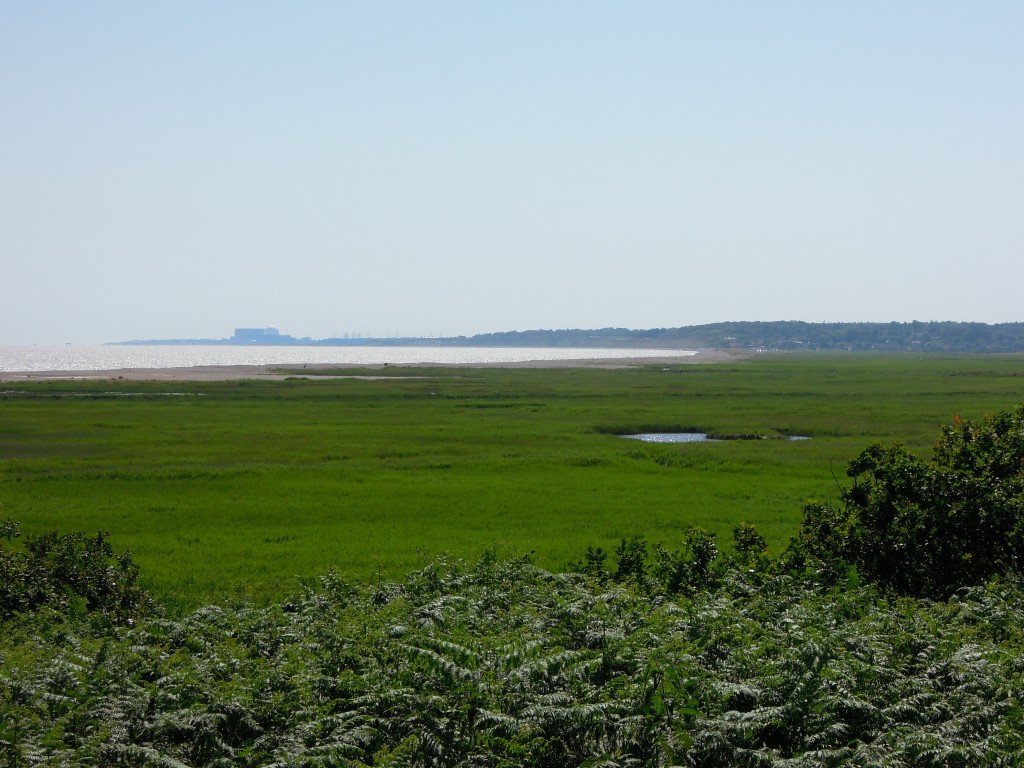
Looking south from Southwold. Sizewell nuclear power station on horizon. Bay in the middle used to contain Dunwich

View south from lovely Southwold. Sizewell nuclear power station is on the horizon. Note the sharks-mouth bite in the coast in between, where Dunwich used to be.

Geologically England’s east coast is part of the North Sea basin. In the Dunwich / Southwold area the bedrock is the Crag group – sands formed up to 5 million years ago in shallow seas. These are only weakly lithified – as much sand as sandstone – and so basically identical to the banks of sand found offshore today. The area is extremely flat, the photo above was taken at only 15m above sea-level but gives a clear view over 10s of kilometres horizontal distance.

This adds up to a landscape that was formed by the North Sea and which can be transformed by it. Seas move sediment around all the time. Tides, waves and especially storms can move massive quantities of sand and gravel to and fro, in often unpredictable patterns. What happened to Dunwich is geologically unremarkable. Over 1000 years a 10-20 metre thick layer of sediment was eaten away and moved elsewhere on the seabed. If this happened offshore, we’d barely notice, but 20 metres can be a long long way – vertically its the distance between a seaside pub and a sandy sea-bed. In human terms these places could hardly be further apart.

The first historical mention of erosion at Dunwich is found the in the Domesday book. Written in 1086, this survey ordered by William the Conqueror of his new kingdom, describes a town that had been important for over 500 years. As an important port and fishing village Dunwich owed a lot to the sea , it was a place where feudal dues could be “£4 and 8,000 herrings”.  Already it was clear that land was being lost:  “Then [there were] 2 carucates of land [one carucate equals 120 acres], [but] now one; the sea carried off the other.”

The sea started to ‘carry off’ a lot more land in the next 1000 years, at an average rate of a meter a year. This rate wasn’t steady. If storms, tides or winds pull together, sudden and dramatic changes can happen. In March 1286 a strip of land up to a hundred metres was washed away, destroying churches, houses and lives in the process. January 1328 saw high tides, storms  and further destruction.
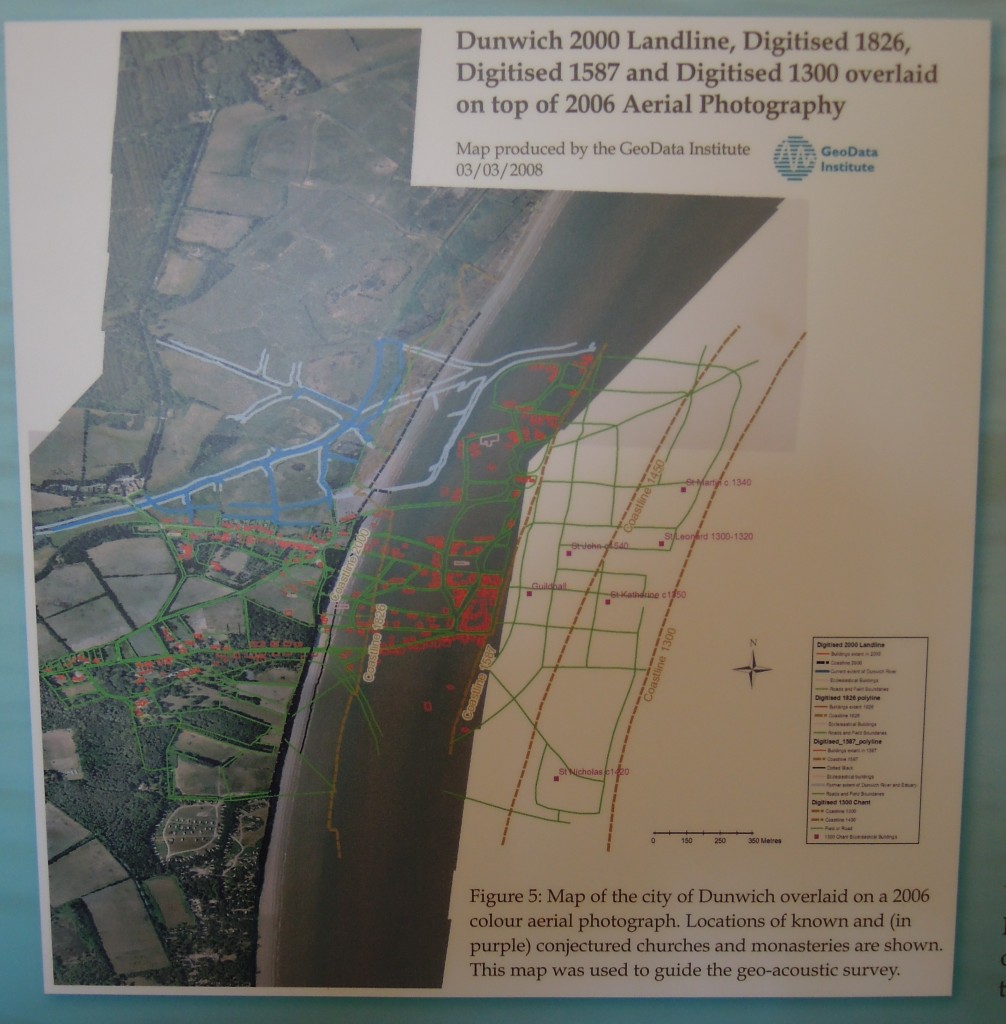
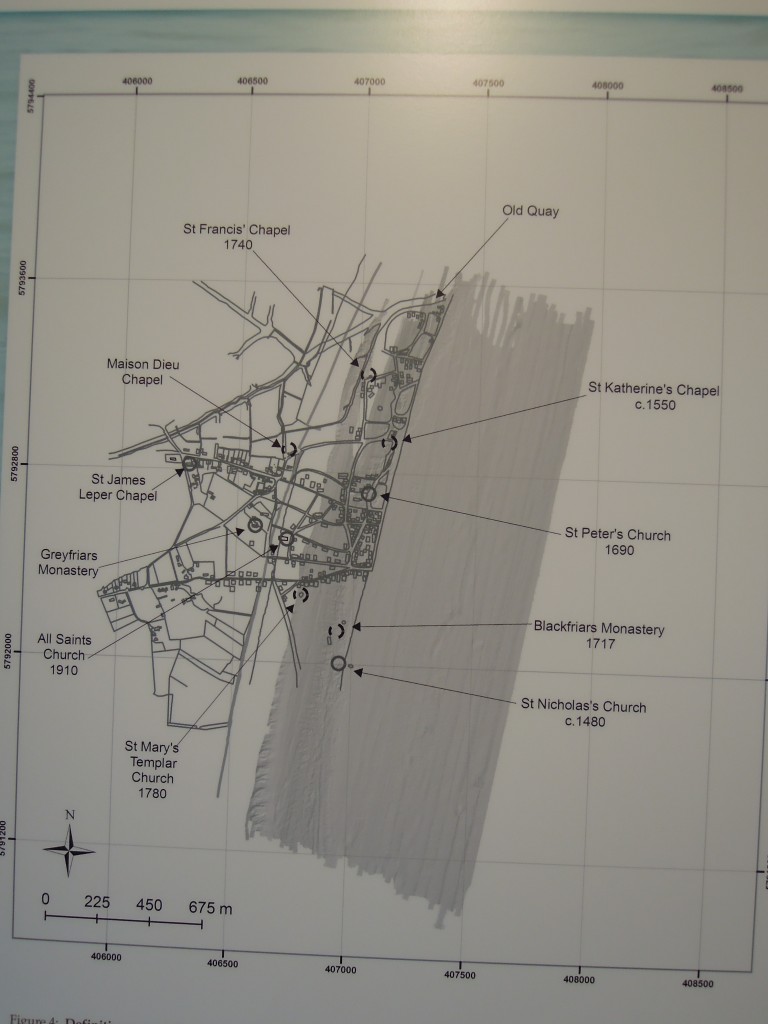
Map of Dunwich showing street-map of lost town

Map showing historic Dunwich and current coastline, from Dunwich museum. Note the far right line is only the 1300 coastline, Dunwich extended further right before this time.

Over this same time, movement of sediment above sea-level caused another serious blow to the town. Dunwich’s wealth and importance was based on its harbour, centred around a large area of calm water where the end of the river Dunwich was protected by a large shingle bank called “Kings Holme”. The river Blyth, that passes between Southwold and Walberswick also sat behind the shingle bank, which meant it reached the sea near Dunwich. Ships from Walberswick therefore had to pay tolls to Dunwich for the right to reach the sea. The two communities did not get on.

In 1250 Kings Holme extended south so as to completely cover the harbour mouth at Dunwich. The rivers found a new exit to the sea near Walberswick, which would mean Dunwich ships paying tolls to Walberswick. Unwilling to accept this change in fortune, the people of Dunwich dug a channel to the sea through their town and forced the closure of the Walberswick gap, creating much ill-feeling. The storms of 1328 finally blocked the Dunwich channel. Since then the low land behind Kings Holme has silted up and it is now ‘marsh’ filled with reed beds. The river Dunwich still reaches the sea at Walberswick, running north parallel to the coast for 5 kilometres.

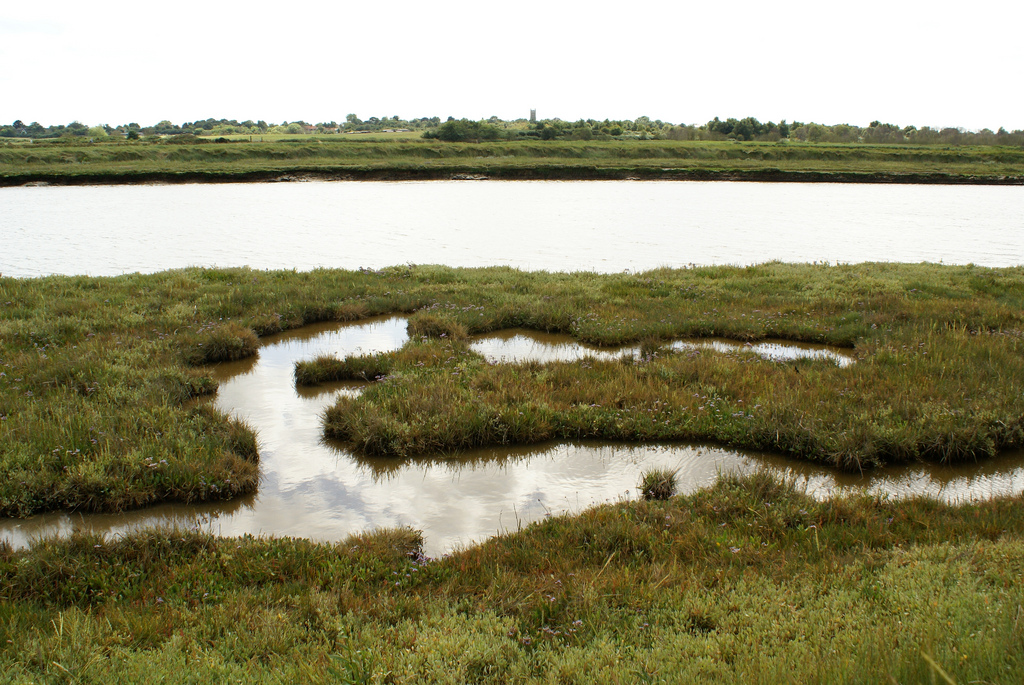
view of marsh looking towards Dunwich

view of marsh behind Kings Holme, looking towards Dunwich

The events of 1328 saw the beginning of the end for Dunwich. Slow decline followed as people left and the sea kept nibbling away.

Dunwich map from Dunwich museum

Map showing later stages of Dunwich’s decay, from Dunwich museum

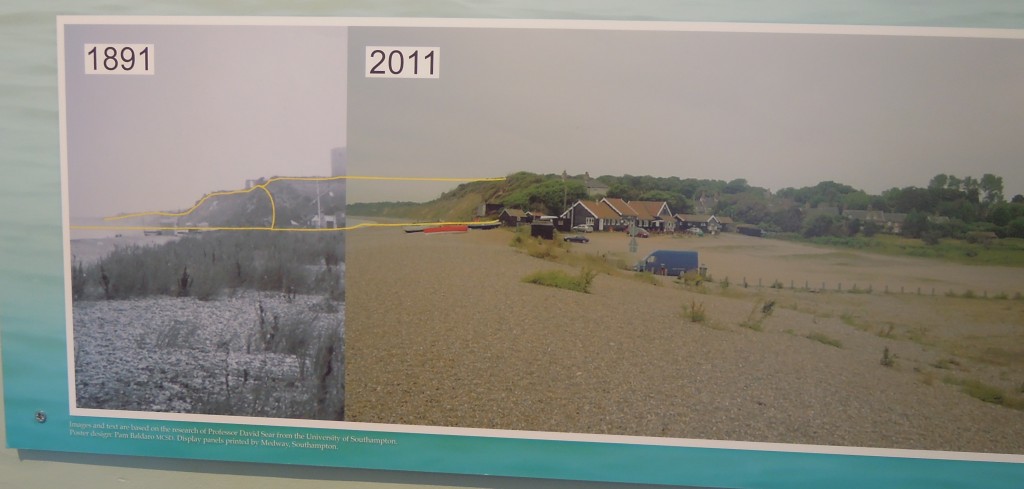
As we get nearer to the present time, the detail of Dunwich’s destruction becomes clearer. With the advent of photography, we can move from maps to pictures.

photo-mosaic showing erosion at Dunwich, from Southwold museum

photo-mosaic showing erosion at Dunwich, from Southwold museum

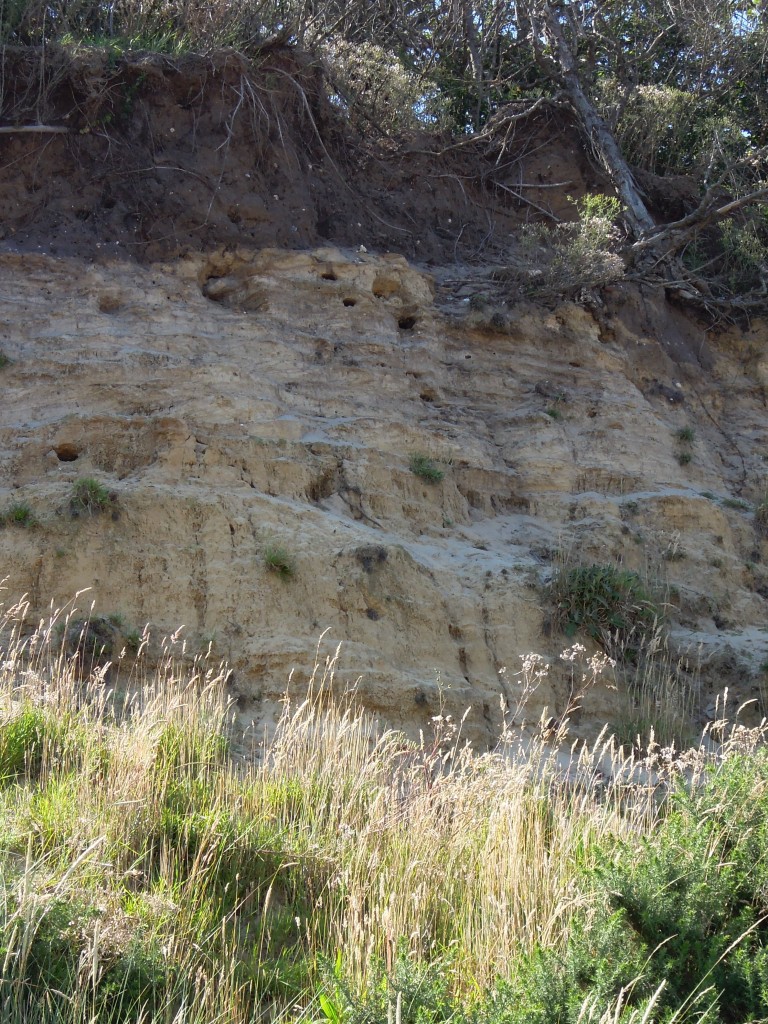
Dunwich today is an odd place. The beach is steep shingle, with some miserable looking cliffs made of soft sandstone.

cliffs at Dunwich

Its a worn-down stump of a town, but is enlivened by its past. The museum is excellent and well worth a visit. The area is of great archaeological and historical interest, with groups studying the remains on the sea-bed and other sites discussing the history. One bonkers idea I quite like (which will never happen) is to stick metal poles in the sea-bed, to create a sculpture above the sea showing where the churches once stood.

Today Southwold is the clear winner in the battle of the towns. It has a pier, a lighthouse, a brewery and a sandy beach surrounded by beach-huts. Once described as being like “the 1950s, but with olives” it combines timeless charm with modern gastronomy. Affluent urbanites (like me) come to enjoy the sea-side experience, complete with local pork pies and beer.

Southwold even beats Dunwich for history, as its mediaeval church remains. As a relative backwater for 600 years, Suffolk churches contain many 14th and 15th century features, like painted rood screens covered in colourful pictures of saints. In most of England these Roman Catholic features have been completely removed during the last 500 years of Protestantism. In Suffolk they were (literally) defaced by Protestant reformers in the 16th and 17th centuries as being ‘idolatrous’, but apart from these rough chisel marks they remain untouched, a glimpse of a former world.

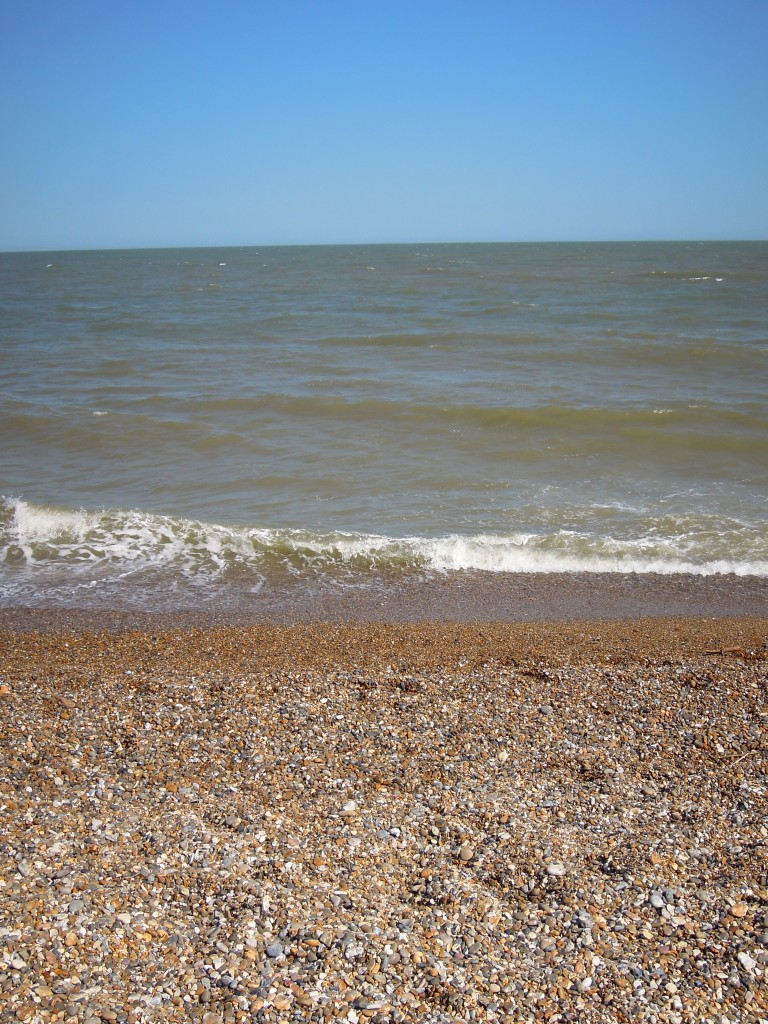
sea at Dunwich

The hungry sea

I love visiting the Suffolk coast, but I wouldn’t buy a house there. Modern studies of coastal dynamics suggest that while Dunwich and other areas will continue to be eaten away, Southwold and the nuclear power stations at Sizewell are safe, for now at least.

These studies work on an engineering timescale. Even if they have fully factored in the impact of increased sea-level and more intense storms that we expect a warmer future to hold, they still only deal with time-scales of decades. To a geologist, places like Dunwich are a reminder of the small scale of human activity. Sea levels will change, sediment will move, coasts will shift. Whether a town benefits or suffers from this is out of our control, as the people of Dunwich learnt to their cost.

The hungry sea

Things have been quiet over here for a while. I’ve been singing a lot (Olympic torch ceremony, recording) plus other things have been taking up my remaining time and energy.

I feel a burst of energy now as I’m going off on holiday soon, to Suffolk in the east of England. Part of me still can’t believe I’m going to one of the flattest parts of the country, where the nearest metamorphic rocks will be under my feet. I’m getting over that feeling now, on my fourth visit. Suffolk is very different from my ‘ideal’ holiday location but it has a weirdness, a spookiness that I’m growing to like very much. It’s all about the sea, which is quiet and grey, but hungry.

from http://www.flickr.com/photos/bridgetmckenz/3797966322/sizes/l/in/photostream/

West is best?

The British Isles has a tilt to it. Broadly speaking, the rocks in the north and west are rising up and those in the south and east are sinking. This is slow, finger-nail slow, of course but important nonetheless. Part of the cause is post-glacial rebound. There was a big ice-cap over northern Britain that squashed the ground down. It melted only recently (a mere 10,000 years of so) so the ground is still flowing back to where it was. Where the ice was, the ground is moving up, but in the south and east it is sinking (mass must be conserved, so if some areas rise, others must sink).

One consequence is that north and west is where the oldest rocks are found, in places like Assynt. Rocks are old and hard. Coasts are craggy, often spectacular. The water is the Atlantic Ocean, so wave fetches are large, storms spectacular and the sea is a dramatic presence. The sea fights the land, but it loses as the rocks are tough. This is a dramatic land of dreams and for centuries it was the edge of the known world.

In soft old Suffolk, things are different. The rocks are young and unconsolidated. To my hard-rock-snob eyes they are barely rocks, they are just piles of sand and mud. The sea is the  North Sea which is just a wet patch between Norway and the UK. Geologically it is a Mesozoic continental basin (full of oil and gas) which is almost completely full. Trawlers dredge up flint arrow heads from Dogger Bank – to our ancestors this was dry land.

But this lack of distinction between sea and land is what makes Suffolk so unworldly. The rocks are not the bones of past orogenies like in the west. They are parts of the North Sea basin that happen to lie on land. They were created by the sea, and the sea will take them back, if it likes.

The North Sea is not as dramatic as the Atlantic, but it is hungry. Coastal erosion is an ever present feature of the Suffolk coast. The town of Dunwich used to the be the capital of Eastern England, a major town full of churches and people. It has been almost entirely swallowed by the sea. Where rocks are soft and land is soft, the erosion of metres thickness of sediment can add up to kilometres of land becoming sea. From a sedimentary basin perspective, this is mere detail. If your house is built on that land, it is rather important.

For some reason nuclear weapons are associated with unusual landscapes. Like the deserts of New Mexico, or Kazakhstan, the coast of Suffolk is linked to nuclear fission. Just south of Dunwich, Sizewell hosts two nuclear power stations, one decommissioned, one active. Visually they dominate the coast. I’ll forever associate them with the best concert I’ve ever been to. This involved fabulous singing of Renaissance and twentieth century music, combined with fisherman’s huts and the projection of video onto the massive concrete side of a nuclear power station.

A place in Suffolk I’ve yet to visit is Orford Ness. This is where all the eroded land ends up, is a nature reserve, yet is full of unexploded bombs and had a role in Britain’s nuclear program. I’ll be there next week, and at Dunwich, with camera and a hope to provide you with some more geologically-focussed posts.

I’ll leave you with a musical treat, a depiction of a Suffolk storm from the great Benjamin Britten. This is the sort of storm that eat towns.

Image of Suffolk Coast courtesy of bridgetmckenz on Flickr.

Cycling in the Pennines – 300 million years ago

The north of England is dominated by rocks of Carboniferous age, which give it a distinctive scenery and history, where local coal fuelled the world’s first industrial landscape.

The geology is extremely well known, because of the importance of the coal deposits, but also because of the continuing excellence of the British Geological Survey. A recent paper shows how their deep knowledge allows them to identify and quantify cycles of sedimentation, some of which are less than 100,000 years in duration (a geological eye-blink).

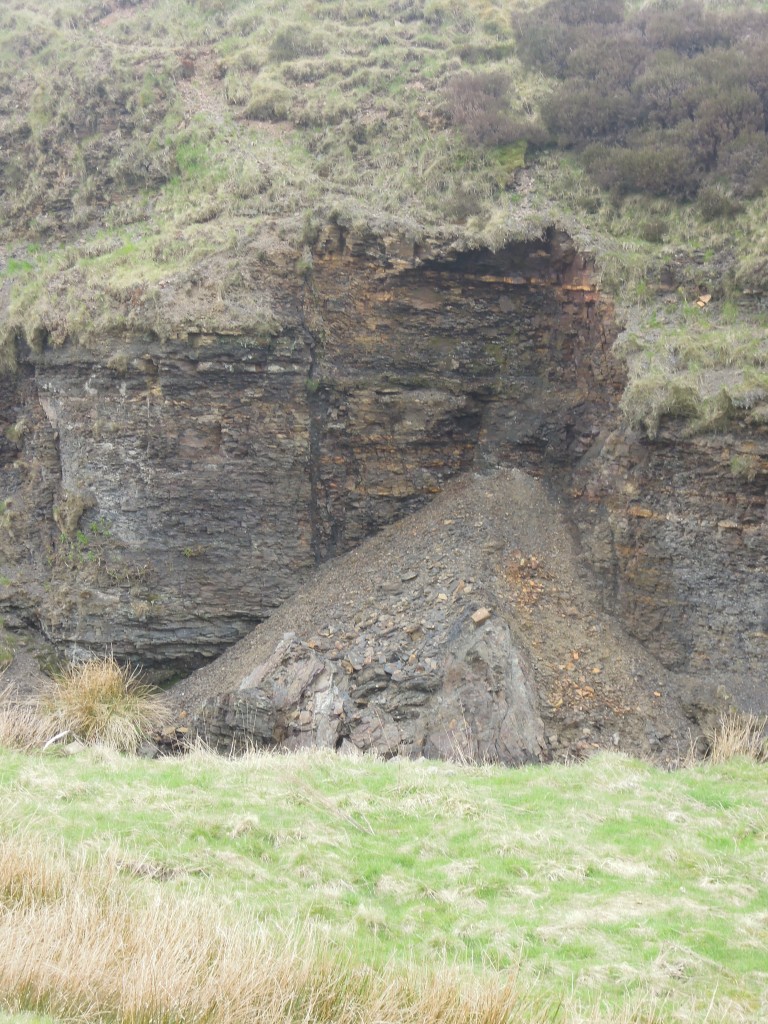
Carboniferous shale, Goyt's Moss

Carboniferous shale, Goyt’s Moss

Spotting the cycles

In an earlier post I’ve written about the rock types found in this area, the Pennine Basin of northern England, so here I’ll cover the broad geological context only.

The early Carboniferous in England was a time of extensive rifting, caused by plate tectonic goings-on further south. This created deep ‘gulfs’ in the grabens and shallow platforms between (horsts and grabens if you’re feeling German). All sedimentation was marine, mud in the gulfs and limestone on the platforms. By the mid-Carboniferous the extension had finished, but the thermal disruption it caused remained, meaning that cooling of the crust caused slow but constant subsidence through the rest of the Carboniferous. The mid to late Carboniferous (Namurian and Westphalian, in local terms) was dominated by shallow water,  mostly non-marine sedimentation. A time of rivers, deltas and coal swamps, all close to sea level.

Its long been noticed that they are regular sequences within these rocks. Coal deposits occur regularly and can be correlated from pit to pit for 10s of kilometres. In a similar way ‘marine bands’, thin layers of shale containing marine fossils, are seen again and again. These marine bands contain goniatite fossils (older relatives of ammonites) which evolve rapidly and can also be correlated from place to place. Often the marine bands are succeeded by coarsening-upwards sequences that move into non-marine rocks – in turn topped by another marine band.

As recently as the 1980s this regularity was explained rather feebly in terms of ‘avulsion of deltas’ or some such.  Even to this spotty teenager, it wasn’t a convincing story. When sequence stratigraphic concepts arrived soon after, they were a natural fit, particularly when marine bands were correlated across different basins in Europe, showing that the cause couldn’t be local.

There are extensive Carboniferous glacial deposits in many parts of the world. The idea that the waxing and waning of polar ice-caps has a major influence on sedimentary patterns across the world is now common place and it fits these rocks well. Melting of polar ice will cause flooding globally, putting marine mud on top of areas previously above sea-level – this was as true for the Carboniferous as it may be for the Anthropocene.

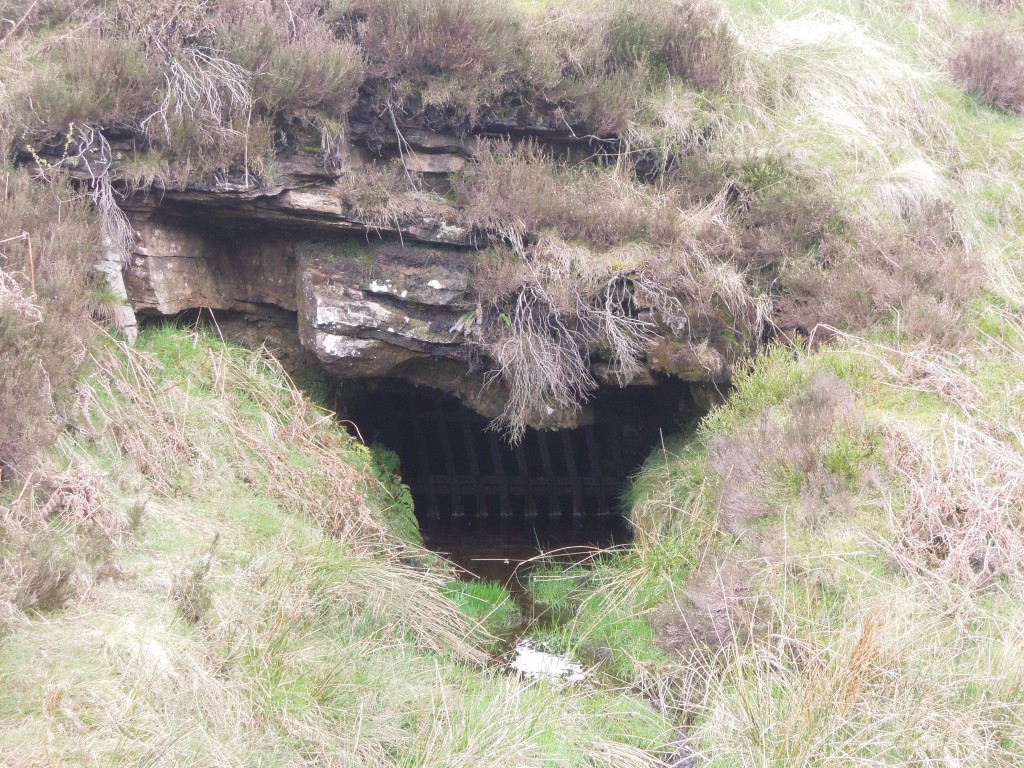
'Sough' a drainage tunnel from shallow coal mining, Goyt's Moss

Carboniferous sandstone. Note the ‘sough’ – a drainage tunnel from shallow coal mining, Goyt’s Moss

Measuring the cycles

In Nature and timing of Late Mississippian to Mid Pennsylvanian glacio-eustatic  sea-level changes of the Pennine Basin, UK Colin Waters and Daniel Condon of the British Geological Survey take a massive data set and use it to quantify how long these cycles of sedimentation took.

Sequence stratigraphy emphasises the identification of significant surfaces that correspond to significant changes in sea level. Sequence boundaries are associated with sea-level falls and parasequence boundaries with sea-level maxima. Waters and Condon link Pennine rocks to sequence stratigraphy: “The marine bands occur at the base of marine to non-marine upward-coarsening cycles, equating to the parasequence of the Exxon sequence-stratigraphic model“; marine bands are maximum flooding surfaces. They identify 47 of these and use current day areal extent to infer which ones represent bigger sea-level rises. Minor unconformities, where valleys have been cut into older sediments, can be linked to sequence boundaries – if sea-level falls then river channels will deepen. These palaeo-valleys are rather subtle structures, but they have been mapped out across northern England.

Waters and Condon start by looking at distinctive layers of mud with great names, one is a bentonite, the other a tonstein. These are layers of volcanic ash and they contain primary zircons, volcanic grains that lock in the age of the eruption. Analysis of these grains allows them to calculate accurate dates for when the layers were deposited.

These dates are not just of local interest. Carboniferous rocks in Europe are correlated on the basis of marine fossils, such as goniatites in marine bands. From this, geologists create a biostratigraphy that allows you to know the age of a rock from the fossils within it. The ideal is a global biostratigraphy, but the nature of the fossils found in Carboniferous rocks makes this difficult.

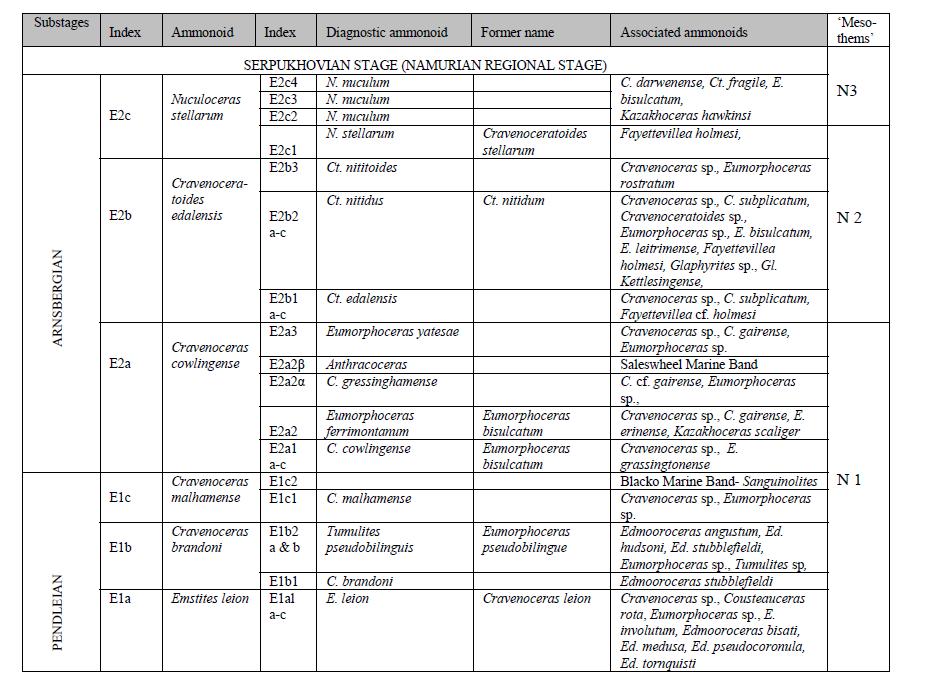
Carboniferous biostratigraphic column from Waters and Condon

This section of the European biostratigraphy shows how fossils track the passage of time. Note there is no age on there. The rate at which new fossil species arise, or sediments are deposited, is not known. Dating a volcanic ash layer, which is found in a particular position in the biostratigraphy, allows you to put absolute dates against the table above, to start to build up a chronostratigraphy. There are other ways of linking the cycles in the sediments to absolute ages, as we shall see…

Understanding ancient cycles

Interpreting the patterns of rocks in terms of sequence stratigraphy provides further constraints on timing. Patterns of sea-level change are linked to changes in orbital obliquity (wobbles in the spinning of the earth) called Milankovitch cycles.  For the Carboniferous we expect long cycles of 413,000 years and shorter ones of 112,000 years.

Putting all these constraints together and using their massive data set, Condon and Waters build up a picture of how distant ice-caps controlled English rocks.

Starting with the big picture, they posit four major ‘ice ages’ for the period in question, each lasting approximately 1 million years.  The interglacial periods are associated with no paleo-valleys and few marine bands – sea level is fairly stable.

For the intervening rocks, they see two patterns in the marine bands. At times they follow a 400,000 year cycle, at others 111,000 or 150,000 years. The patterns of rocks in England are controlled by ancient wobbles in the earth’s rotation. This is an extraordinary thing. The link between the two is the ebb and flow of ice-caps half-way across world – in Geology sometimes it feels like absolutely everything is inter-connected.

For rare cases where multiple marine bands contain the same fossils, Condon and Waters infer these must be related to even shorter sub 100,000 year Milankovitch cycles. This is less well-proven as it is based on the assumption that the rate of change of goniatite species is relatively constant.

Although focussed on a small region, this research is interesting in many ways. Firstly it shows how stratigraphers use multiple lines of evidence to build up a picture of earth history. Condon and Waters put dates on the duration of the Ice Ages which are of use when studying rocks of this age anywhere on earth. Also it gives a taste of how aggregating data gives new insights; to map out the marine bands they drew on countless individual data points collected by the BGS over many years.

The work of stratigraphers is not glamorous but it is important. To build up a history of the earth’s history, knowing when things happened is vital.

References, other information

 
ResearchBlogging.orgColin N. Waters, & Daniel J. Condon (2012). Nature and timing of Late Mississippian to Mid-Pennsylvanian glacio-eustatic sea-level changes of the Pennine Basin, UK Journal of the Geological Society DOI: 10.1144/​0016-76492011-047

A late draft of this paper is available to you all via an open access portal.

Courtesy of the BGS, here’s a view of the geology of northern England.

The biggest pile of sand the world has ever seen

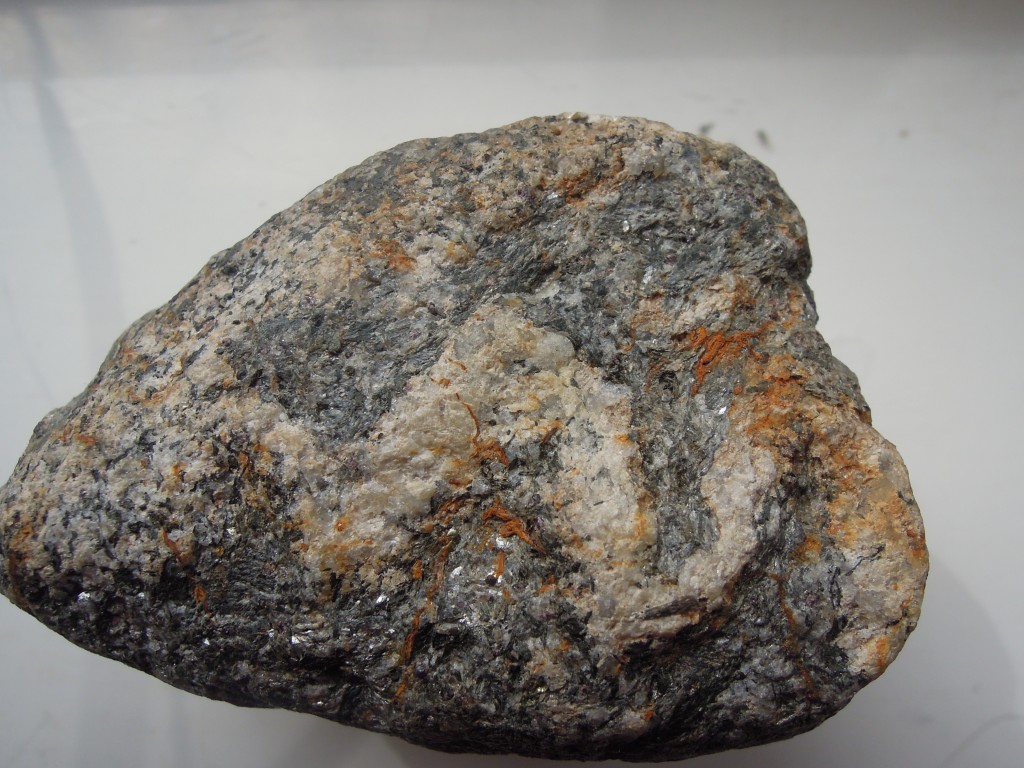
The Moine, a set of sedimentary rocks found in furthest north-west Scotland have enjoyed at least three cycles of metamorphism and deformation. My only sample from here is a migmatitic gneiss, so when I heard about people studying sedimentology in the Moine, my mind was a little bit boggled – gneisses have lost all trace of their sedimentary history. Once I read a bit more I discovered a story about sand. Lots of sand. The biggest pile of sand the world has ever seen, in fact.

High grade migmatitic gneiss with folded granite vein - Moine from Scotland

Metamorphic and sedimentary

Formally ‘the Moine’ is the Moine Supergroup of early Neoproterozoic age. This is a phrase the makes me think of a 1970s prog rock band but it is a stratigraphic term. The Moine supergroup is made up of groups like the Glenfinnan and Morar groups, each of which is a recognisable package of sediments, representing a period of time. The Moine is defined as a group of sediments that formed in a single sedimentary basin.

How did sediments end up looking like the picture above? This sample of gneiss started as mud but has since been buried and heated so it  was metamorphosed (it contains garnet and biotite), melted (the vein of granite) and deformed (the lovely folds). We know it was once mud only from its bulk chemistry. However I’m a big fan of deformation and metamorphism, so I picked a sample that shows these things. A more representative rather different sample of the Moine is seen in this picture.

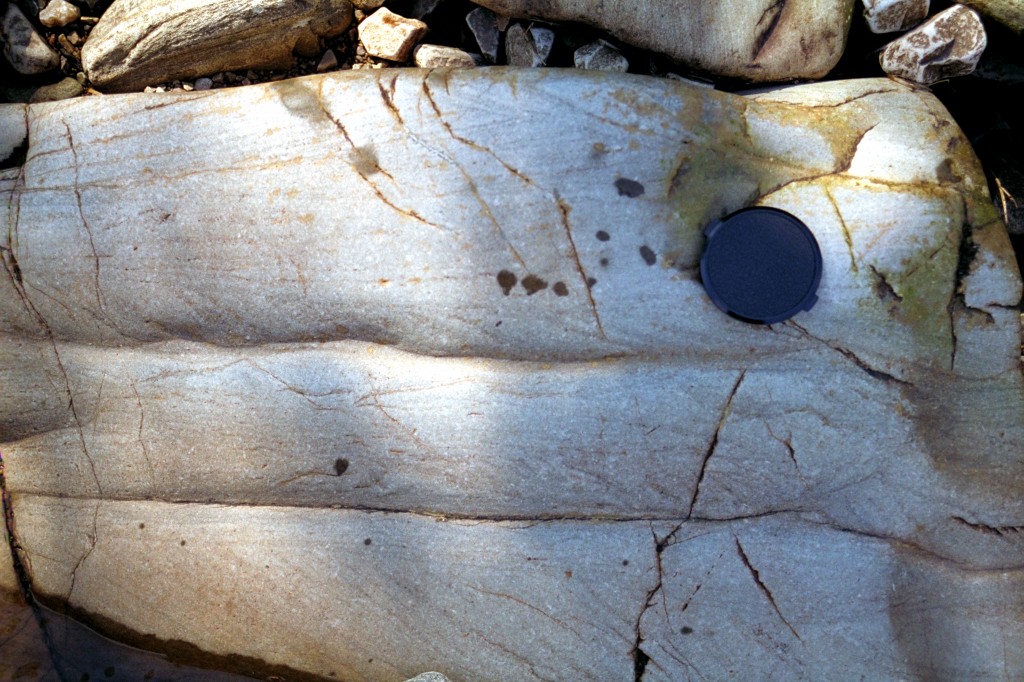
Moine crossbeds from zeesstof on Flickr

This is a sample of metamorphosed sandstone, or psammite in local parlance. A practiced eye will quickly pick out the bedding (horizontal) and cross-bedding (sloping lines). These are primary sedimentary features and if you see enough of these, you can work out the conditions under which the sediment formed.

Why are these traces of an ancient river or sea-bed preserved? There are two reasons.

Firstly the rock is made up mostly of quartz, and so is not affected by metamorphic reactions under normal conditions. During metamorphism the quartz may be recrystallised, but fine structures like cross bedding can survive. Note that some of the lines above are a slightly different colour – these are rich in ‘heavy minerals’ such as Zircon.

Secondly, conditions of metamorphism and (particularly) deformation vary depending on where you are. The mylonites of the Moine Thrust zone were once sandstones, but no bedding can be seen in them now. The Moine rocks have been intensely deformed, but particular areas such as the hinges of folds still contain original sedimentary structures.

Geological paradise

NW Scotland geology map

The map above shows Northwest Scotland. The key structure is the Moine Thrust (MT) which runs parallel to the mainland coast. To the west are foreland rocks – ancient basement gneisses (Lewisian), Proterozoic sandstones (Torridonian) and a thin sliver of Cambro-Ordovician sediments. These last contain fossils that link them to rocks of similar age in North America. All these rocks formed before the Atlantic existed, in fact most formed before the ocean before the Atlantic. For the rest of this story we are in North America, geologically speaking.

East of the Moine Thrust are the Moine rocks, deformed, metamorphosed and containing igneous intrusions, in stark contrast to the sediments to the west…

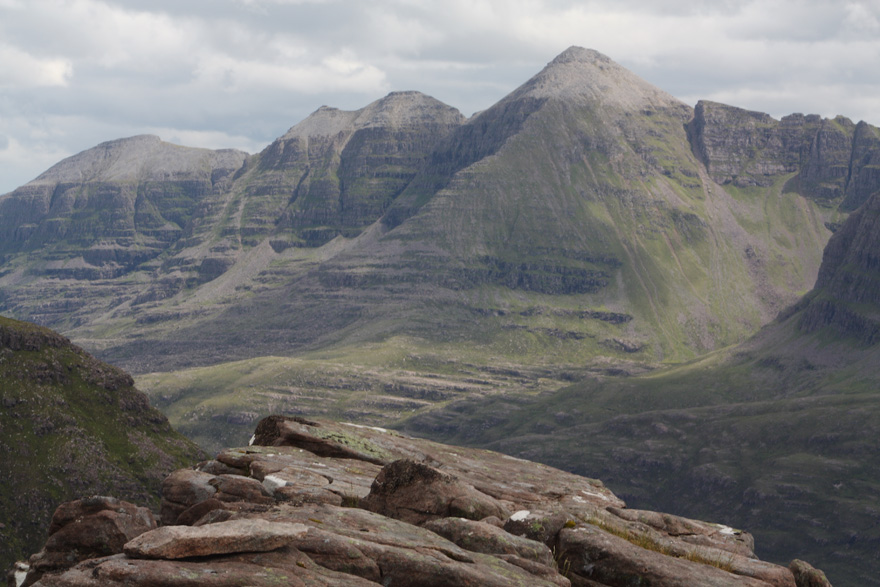
Torridonian sandstone on Liathach, courtesy of Sandchem

This lovely picture of undeformed Torridonian sandstones, with a white cap of Cambrian sandstone highlights the different geological histories either side of the Moine Thrust.

How to explain the difference? One possibility is that the Moine rocks are exotic, brought in from elsewhere as part of an allochthonous terrane. Much of Alaska is made up of large chunks (terranes) which have very different histories but have all ended up being scraped onto the American continent. In the 1990s people were finding applying this then-fashionable concept everywhere, including Scotland. Or possibly the Moine and Torridonian are equivalent; twins separated at birth, who experienced very different histories as they grew older. To decide between these options, what you need is something akin to DNA for sedimentary basins.

Long-lost twins

The ‘heavy minerals’ in sediments are literally heavy. Geologists crush up samples and put them into dense liquids. The quartz floats, the heavy fraction that sinks is separated and analysed. Zircon grains are common heavy minerals and they have a very useful feature – they contain lots of Uranium which is tightly locked in. If you analyse them isotopically, you can tell the age at which they formed, even if they’ve subsequently been metamorphosed.

These ‘detrital Zircons’ will have a range of ages, reflecting the age of the rocks that were eroded to form the sediment. This may have a distinctive pattern that gives a picture of the eroding rocks surrounding a sedimentary basin. This is like DNA for sediments.

Work led by Maarten Krabbendam of the British Geological Survey strongly suggests that parts of the Moine and Torridonian are direct equivalents – twins. Rocks of the lowest part of the Moine, the Morar group have detrital zircon age profiles that are very similar to rocks from the main part of the Torridonian. They are more similarities indeed than between the Morar group and the higher parts of the Moine. Krabbendam and colleagues state that the Torridonian and lowest Moine are “similar in terms of lithology, stratigraphical thickness, sedimentology, geochemistry, detrital zircon ages and stratigraphical position on Archaean basement” which is a compelling case that they are two parts of the same basin.

Lots and lots of sand

The link between Moine and Torridonian tells us that about a billion years ago there was a sedimentary basin covering northern Scotland, containing 6-9 kilometres thickness of sand. To get that much sediment, you need to make a hole to put it in. What formed the sedimentary basin the Torridonian and Moine sediments were deposited in?

To find out, Maarten Krabbendam and Helen Bonsor at the British Geological Survey (with others) have been looking at the Moine rocks as sediments. Detailed field work allows them to create maps and sedimentological logs. Logs are vertical graphical descriptions of many things such as grain-size (mud or sand), sedimentary features or direction of water flow inferred from ripples. Remember that these are highly deformed rocks. The bedding is very rarely flat, indeed sedimentary features may be the only way of telling if the rocks are upside down or not, such is the intensity of folding in the area.

All this hard-won data can tell you a lot. Sedimentary features and patterns allow you to infer water depth. As an example, to quote Bonsor et al: “The presence of pinstripe, flaser and lenticular bedding, bidirectional ripple crosslamination and abundant mud drapes indicates that deposition was strongly tidally influenced“, in other words in relatively shallow sea-water. Other parts of the sequence contain hummocky cross stratification which is associated with deposition in deeper waters.

Add all this up and you get a picture of the sedimentary basin through time. Geologists have done this for many basins where the cause of basin-formation is known. Comparing these with the Moine/Torridonian lets us infer how this particular basin formed.

Many workers have interpreted the Torridonian and Moine as separate rift basins. These are where active faulting makes space in a relatively narrow area. The characteristics of sediments in these basins tend to change rapidly horizontally (over location in the basin) and vertically (over time). Near faults you expect coarse fan deposits. None of these things are seen in the Moine or Torridonian, which were deposited under relatively uniform conditions.

Gentle stretching of continental crust forms ‘contintental sag’ basins. Again this isn’t a good fit for the Moine/Torridonian, in part because sag basins are not often so deep.

Bonsor and Krabbendam argue that the best candidate for the Moine/Torridonian is a foreland basin, like the modern day Ganges. A mountain range pushes down onto the continental plate next to it, forming a hole that is quickly filled by sediment eroded from the mountains. These basins can be wide and deep, with long-lived stable conditions close to sea-level as the bending down of the crust and the amount of sediment arriving reach a balance.

The American connection

If the Moine/Torridonian basin formed next to a set of mountains, there should be traces of these mountains somewhere in the geological record. Which orogeny formed these mountains?

There are no fossils in these old rocks, but detrital zircons give a constraint on the maximum age of sedimentation. The sedimentary basin is around a Billion years old, and tectonic reconstructions put the basin near the active Grenville orogeny. This is a major event that created a belt of metamorphic rocks found across the North American continent.

A large range of mountains produces a lot of sand. A billion years ago there were no land plants – nothing like Rhododendrons that stabilise slopes in the Himalayas – so rates of erosion would be higher. It’s also been suggested that the Grenville mountains were located so as to get monsoonal weather patterns. The combination of high precipitation and no vegetation would have caused extremely high erosion rates and created an awful lot of sand. Perhaps the biggest pile of sand the world has ever seen.

A question: If there is a Grenvillian foreland basin in Scotland, why can’t I find anything out about an equivalent in North America? I can find references to equivalent basins in Greenland and Scandinavia but not America itself. Anyone care to suggest why not? [See interesting comments from F below]

References and further reading

ResearchBlogging.org
H. C. Bonsor, R. A. Strachan, A. R. Prave, & M. Krabbendam (2012). Sedimentology of the early Neoproterozoic Morar Group in northern Scotland: implications for basin models and tectonic setting Journal of the Geological Society DOI: 10.1144/0016-76492011-039

H.C. Bonsor, R.A. Strachan, A.R. Prave, & M. Krabbendam (2010). Fluvial braidplain to shallow marine transition in the early Neoproterozoic Morar Group, Fannich Mountains, northern Scotland Precambrian Research DOI: 10.1016/j.precamres.2010.09.007

MAARTEN KRABBENDAM, TONY PRAVE, & DAVID CHEER (2008). A fluvial origin for the Neoproterozoic Morar Group, NW Scotland; implications for Torridon–Morar Group correlation and the Grenville Orogen foreland basin Journal of the Geological Society DOI: 10.1144/0016-76492007-076

The British Geological Survey now puts its research papers into an Open Access archive. Good for them. Encourage them by going and reading the actual papers I’m talking about.

I’ve talked most about Bonsor et al. (2012) as its the most recent. Bonsor et al. (2010) covers different ground using the same techniques. Looking at a different aspect of the Moine, Krabbendam et al. (2011) summarise some of the structural work the BGS are doing in parallel with the sedimentary studies.

Location map taken from Krabbendam et al 2008 with implicit permission of Geological Society of London

Torridon photo with kind permission of David Shand (Sandchem on Flickr).

Moine cross-beds from zeesstof on Flickr under Creative Commons

The BGS have a new feature of embedded geological maps in your web pages. I’ve had a go below, centred on the North-west Highlands.