Winds of change

There’s a fabulous new site that shows wind patterns – it gives you a whole new perspective on the globe. One of the most striking things is the regular patterns across the oceans. Until quite recently long-distance travel was dependent on sailing boats, at the mercy of the wind and regular patterns of wind were needed to support regular sailing routes. The goods and people moved by these winds in turn drove dramatic historical changes that still resonate. Let’s look at a few, illustrated by the Earth Wind Map.

Turn of the sea

In the early 15th Century, Portuguese sailors began exploring the Atlantic ocean. Initial footholds were made on groups of volcanic islands: the Azores and the Canaries. Regular travel between these islands and Portugal taught sailors an odd trick: the best route back home was not a straight line but instead a big loop. This ‘volta do mar’ or ‘turn of the sea’ relied on working with the prevailing winds and ocean currents.
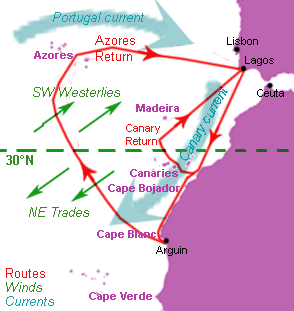
Atlantic winds (green), currents (blue) and approximate Portuguese sailing routes (red). Image from Wikipedia.

Atlantic winds (green), currents (blue) and approximate Portuguese sailing routes (red). Image from Wikipedia.

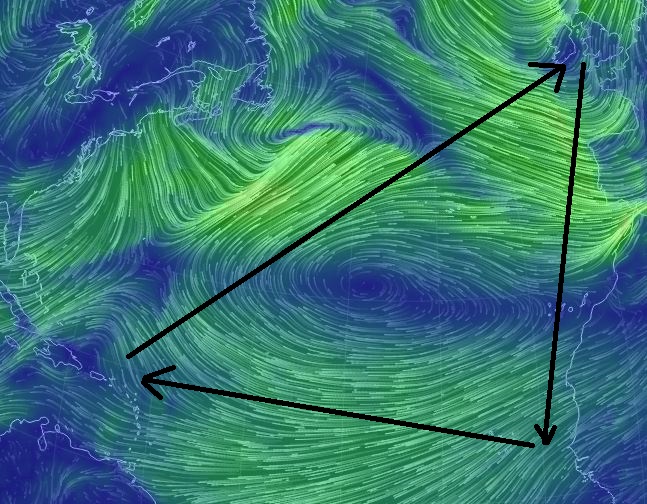
Here’s how the Earth Wind map looked for this area recently: the same pattern can be seen even in this snapshot of actual conditions.
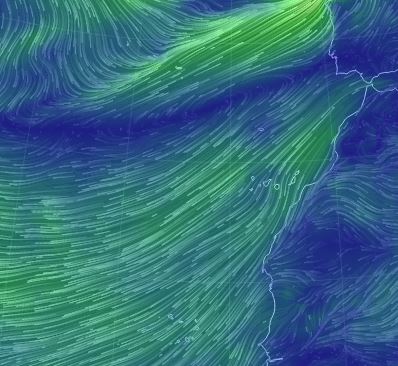
Image captured from Earth Wind Map. With permission.

Image captured from Earth Wind Map. With permission.

Later sailors showed this pattern to be of global significance. It stretches across the entire Atlantic – Columbus used it on his return from the Americas. Eventually Spanish sailors correctly guessed that it applies to the Pacific, allowing the Spanish empire to connect Central America and the Philippines.

These patterns are caused by global circulation of the atmosphere. Warm air rises at the Equator and flows up and towards the poles. At around 30° latitude (north or south) it descends again into a region of high pressure called the Horse latitudes. Further north a different circulation cell is found, forever whirling in a different direction. These flows of air, on a spinning globe, create patterns of prevailing winds: ‘trade winds’. These patterns are fundamental features of the earth and have been recognised in ancient climates.

Spice

The Portuguese weren’t the first people to sail long distances, of course. Trade across the Indian Ocean between Africa, the Middle East and India was established long before; it supplied the Romans with spices as well as lions and tigers for their circuses.

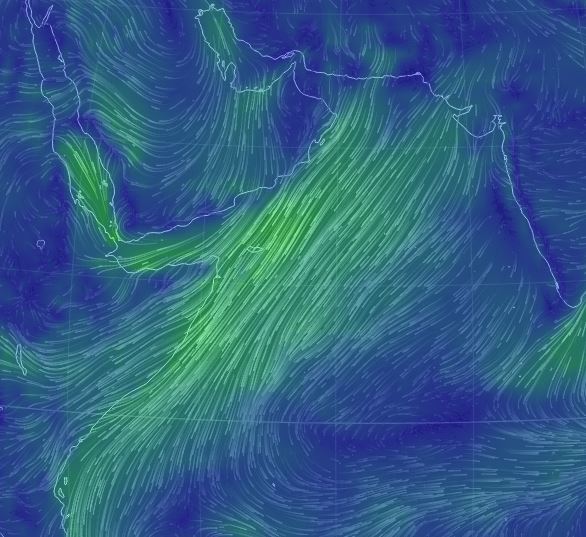
The northern Indian, like the Atlantic at the same latitude, has trade winds that move towards the south west. This is convenient if you want to speed your cargo of hungry tigers from India over into the Red Sea and via Egypt to Rome. But how do you get a cargo of gold coins to India to buy the animals in the first place? Unlike the Atlantic, the horse latitudes are on-land: there is no turn of the sea to get you east.

Indian Ocean2

The winter pattern of winds, away from India

In the Indian Ocean something remarkable happens. The billion year old trade winds are switched, flipped completely round every year. From May until October winds blow from the south and west, towards India. This pattern allows repeat journeys and supports trade. In later centuries these winds sculpted a maritime ‘Dhow culture’ that stretched from the East African coast via Arabia into India.

What has the power to overturn a global pattern of wind? The Himalayas and the Tibetan Plateau do. This massive area of high altitude land was formed and is kept aloft by the ongoing collision between Indian and Asia. During the summer, heating of the high land lowers air pressure, drawing in air from the ocean. This reverses the pattern of winds and brings massive rainfall to India, feeding crops that feed millions.

Sugar, gold and blood

European exploration of the Atlantic of course led to the ‘discovery’ of the Americas, a new land full of Silver and Gold and indigenous civilisations collapsing under the onslaught of vicious diseases to which they had no immunity.

For many, the question was: how to make money from this new land? For the Spanish in central and south America, silver and gold was the obvious answer.  The Portuguese in Brazil and the English and others in North America and the Caribbean turned to farming, preferably of addictive substances.

Sugar, cotton and tobacco could all be grown in the Americas and shipped west to newly addicted populations in Europe. But who was going to grow the stuff? Shamefully, the answer was slaves from Africa, sold in exchange for rum or textiles made in Europe (from ingredients grown in the Americas).  Part of the reason this system worked was to do with the winds. The ‘turn of the sea’ was scaled up into the ‘triangular trade’ that took ships from Europe, to Africa, to America and back again.

triangular trade

In time Europeans realised the full horror of this system. The world’s first consumer boycott was of sugar, first organised in Britain in 1792. They realised that not a cask of this slave-grown sugar came into Europe “to which blood is not sticking”.

Tea

What the British mostly did with sugar was put it in their tea. Until the mid-19th Century, drinking unboiled water in a British city was a good way to die young. The traditional solution to this was to drink beer or gin – both sterile, if not completely healthy. In time, powered by growing commercial power in Asia, tea replaced booze as the British drink of choice (at least during working hours). This thirst drove the last great flowering of commercial sailing ships: the tea clippers.

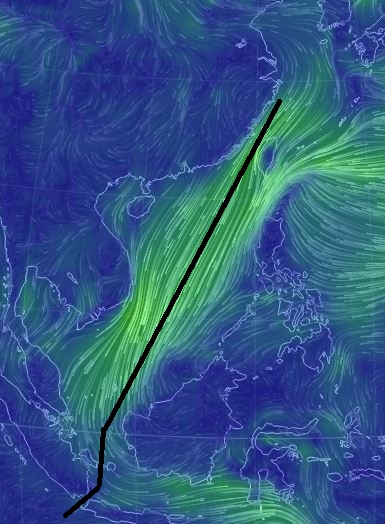
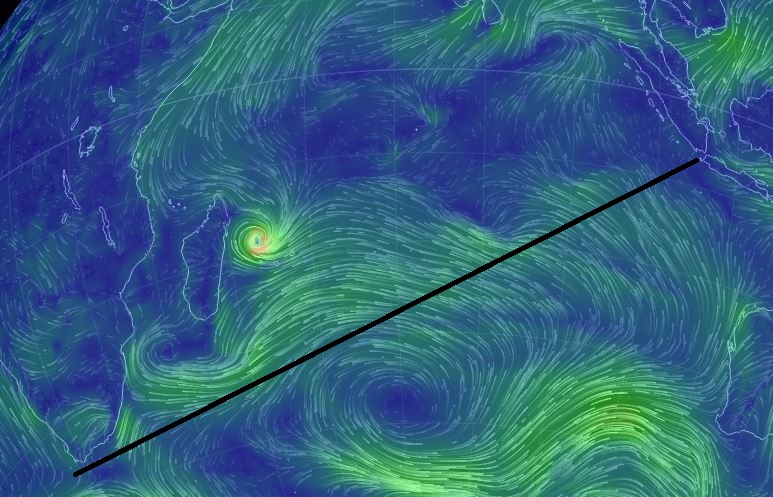
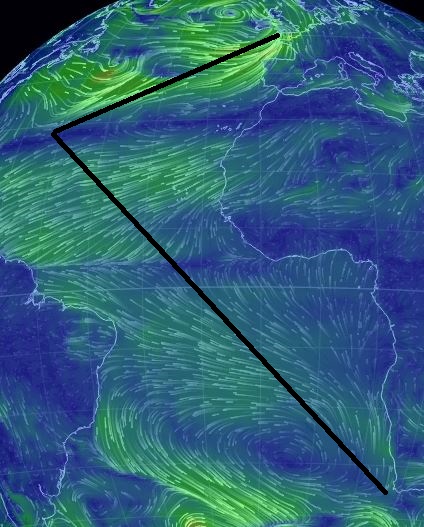
Tea is a seasonal crop and the best tea is fresh tea. For these reasons fabulous beautiful ships were built to speed it across the world. The great tea race of 1866 saw four sailing ships race from China to Britain packed with tea. The first ship to arrive would command the best prices. The route they followed was the fastest possible, drawing on hundreds of years of knowledge of the trade winds. Let’s trace their winding route on a windy globe.

From China, down the South China Sea through the Sunda Straight

From China, down the South China Sea through the Sunda Straight

Across the Indian Ocean and round the Cape

Across the Indian Ocean and round the Cape

Back to Blighty, past St Helena and the Azores

Back to Blighty, past St Helena and the Azores

New Scottish Oil field discovered (470 million years too late)

Scottish oil is topical. Most of Britain’s oil and gas deposits sit under the seabed around Scotland but the revenues are shared with the whole of the United Kingdom.  If Scotland decides to become an independent state (there’s a vote in 2014) then that wealth will be all theirs. So I was very interested to read about a new Scottish oil field that has been discovered. There’s only one reason you’ve not read about this in the papers: all the oil was boiled off 470 million years ago.

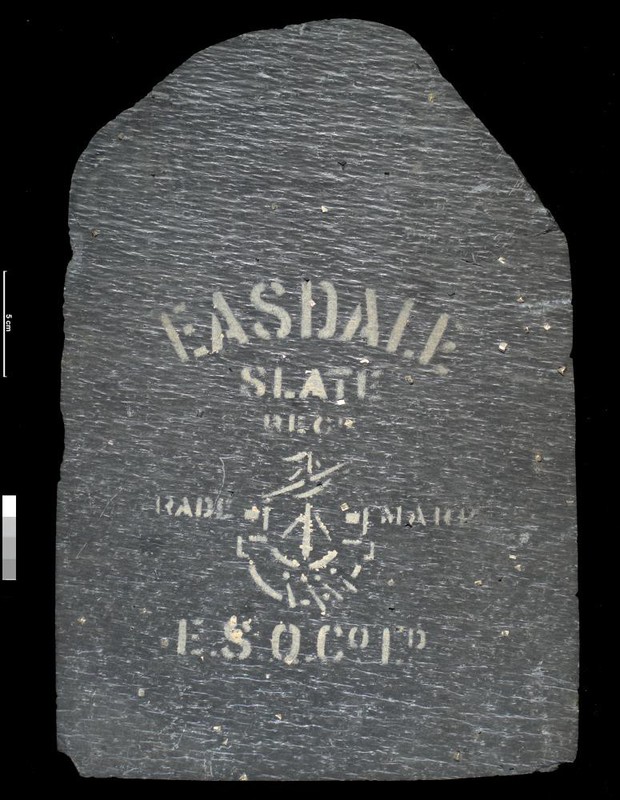
easdale slate bgs

Easdale Slate sample. From British Geological Survey, sample P519560

Oil deposits form from dead critters – buried organic matter. Bury this carbonaceous material deep enough (often in black mud) and it heats up and enters the ‘oil window’. These ‘source rocks’ then produce oil which seeps away. In ideal conditions it enters a rock rich in holes (the reservoir) and is prevented from rising further by impermeable rock layers above (the seal).

Most oil deposits are found in more recent rocks, from the last 541 million years where traces of life are everywhere (the Phanerozoic). We know from rare fossils and geochemical evidence that life was abundant before this time, it was just mostly microscopic bacteria or algae. The ‘Cambrian explosion’ is rightly celebrated for the creation of new lifeforms, but its impact is partly due to innovations like hard shells and burrowing in sediment that made ancient life much more visible. It doesn’t necessarily represent a step-change in the raw *volume* of life. Before the Cambrian, there was lots of carbon being ‘fixed’ and sinking into sediment – many oil deposits are found from the next oldest period, the NeoProterozoic (1,000  to 542 million years ago).

Scotland contains sediments of this age: the Dalradian Supergroup. Some clever chaps from the University of Aberdeen thought to look in them for evidence of oil. In their recent paper Timothy Bata and John Parnell focus on rocks from the Argyll Group – the Easdale Slate and the Scarba Conglomerate.

Figure 1 from Bata & Parnell 2013

Figure 1 from Bata & Parnell 2013

The Easdale slate is a dark rock that even today contains up to 6.3% organic carbon by weight -it was a good candidate for a source rock. The Easdale sediments formed in deep water and the Scarba Conglomerate was the equivalent shallow water deposit. As a coarse pebbly sandstone it would have contained many small holes, up to 11% by volume, and so was a good candidate for a reservoir rock. Today it is strikingly dark in colour because it  contains abundant solid hydrocarbon residue – it is a fossil oil reservoir. The residue is found within pore spaces and is associated with pyrite crystals which they interpret as forming from Precambrian bacteria attacking/eating the oil.

These rocks are found across Scotland and Ireland – our authors estimate they could have contained over 6 billion barrels of oil. This find isn’t going to affect the vote for Scottish independence in September though. The Iapetus ocean these sediments were deposited on the edge of is long gone and so is the oil. It wasn’t extracted by cunning trilobites but was destroyed along with the ocean. Around 470 million years ago the sediments were buried and heated to high temperatures – the Easdale source rocks were converted from muds into slates useful in roofing. Only useless degraded hydrocarbons remain, the rest would have been returned to the surface as gas.

Rocks equivalent to the Dalradian might be expected to have similar deposits and these are found from Greenland to North America. Other Precambrian fossil oil reservoirs are there to be found – if you live on lightly metamorphosed Neoproterozoic sediments in eastern North America or in Norway, you might be sitting on the ghost of an oil-field.

Bata T. & Parnell J. (2014). A Neoproterozoic petroleum system in the Dalradian Supergroup, Scottish Caledonides, Journal of the Geological Society, DOI:

Getting a nose for folds

Folds are found everywhere layers are. Folds are the natural consequence of pushing a rug, cooking lasagna or deforming sedimentary or metamorphic rocks. Sniffing out folds, ‘getting a nose for them’, is part of any geologist’s training.

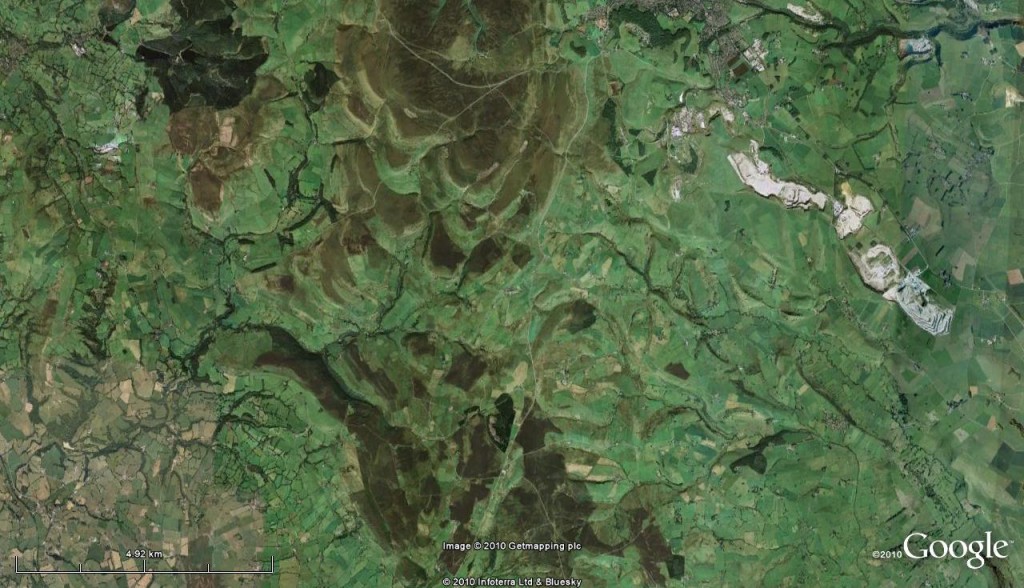
Here’s a Google Earth image of a chunk of northern England.

WoGE-223

What may catch your eye is the pattern of ridges (highlighted by alternating brown peak and green grass) in the central third of the image. There is a “V” pattern that is particularly clear in the southern part. These are sedimentary layers that were originally flat. The image is about 20km across, so on this scale it is basically flat. This means that the pattern can only be explained by folding of those sedimentary layers.

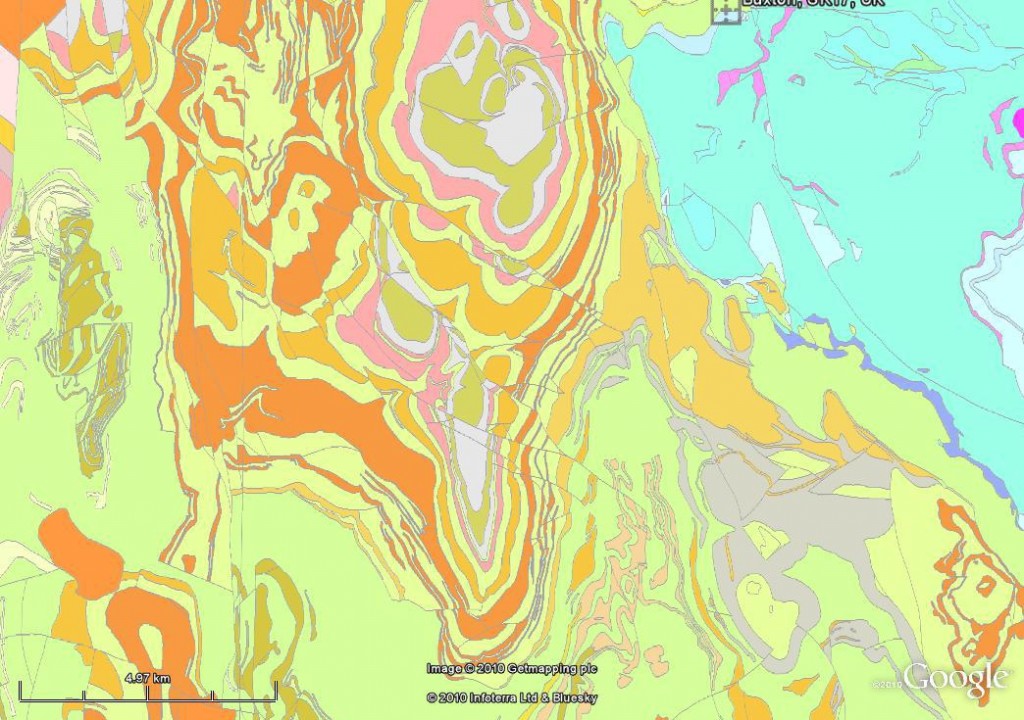
The geological map shows more clearly that the ridges correspond to individual layers of rock (a single colour on the geological map) that are repeated on either side of the “V”.

WoGE-223_geol_map

This structure is called the Goyt Syncline. Away from our astronauts eye view, how does it look on the ground?

20131229_142016

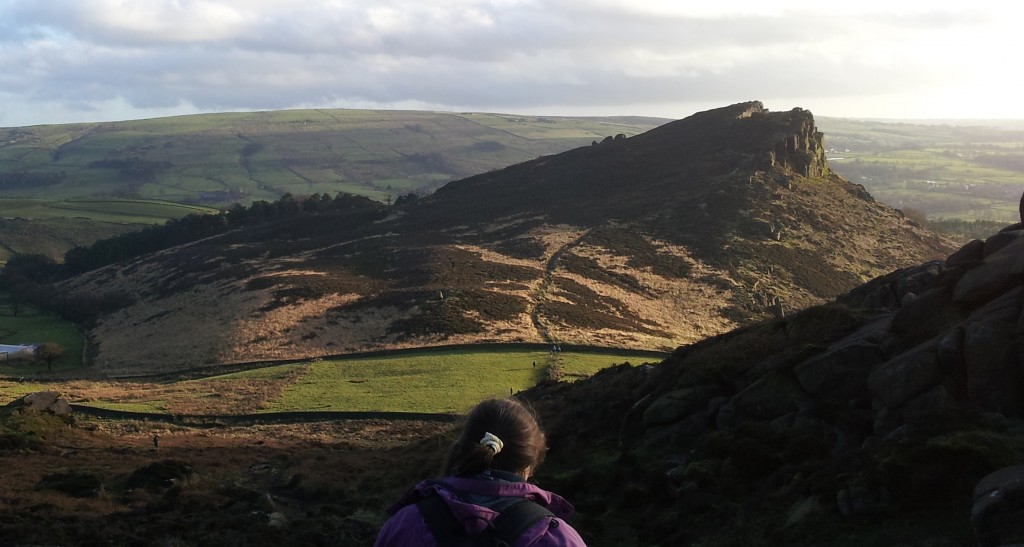
Standing here on one of the ridges (called the Roaches), it is clear the rocks aren’t flat. I hope you can see the flat surfaces sloping down to the left. These are tilted bedding planes.

Here’s a view of the whole fold. The ridge on the skyline is the one the above photo is taken from. It it dipping towards us. The ridge in the foreground is dipping away from us – we can see both sides of the fold. The “V” is lying on the ground, the tip is towards the left.post-Macc holiday 2012 035

And with a bit of annotation:

big syncline image annotated

The nearer ridge, called Ramshaw Rocks is very straight and must have inspired the Romans as they built one of their linear roads just below it.

Finally, here’s a view taken off the left hand side of this picture looking straight at the tip of the “V”.

20131229_155635

The bowl like shape of the syncline fold is clearest here. The two limbs of the fold (the arms of the “V”) are very close here as we are near its tip. This is known as the nose of the fold.

Radioactivity and the earth (and moon?)

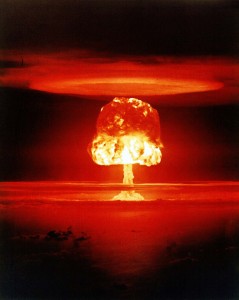
"Castle Romeo" atmospheric nuclear test - March 1954. From CTBTO under CC

“Castle Romeo” atmospheric nuclear test – March 1954. From CTBTO

We tend to think of radioactivity as an artificial thing; some argue that the first nuclear explosions in 1945 should mark the start of a new human-dominated geological epoch called the Anthropocene. These man-made explosions have left distinctive radioactive traces that may well outlive us all.  It turns out that natural radioactivity, even fission reactions, played an interesting role in Earth’s history long before we came along.

A little background

Our sun is a nuclear fusion reactor, taking simple atoms such as Helium and Hydrogen and squeezing them together to create new elements, plus energy. This normal activity, along with dramatic events in a star’s history such as supernovae, have created virtually all the atoms you see around you. Radioactive decay is where large unstable atoms break-up, creating new smaller atoms plus various left-over bits, such as alpha, beta or gamma particles. Sometimes these particles hit other unstable atoms and cause them, in turn to break up. Put enough radioactive atoms of the right sort together and a nuclear fission reaction starts. When nuclear fission is used to generate electricity, the reaction is controlled. If used to kill people, a chain reaction is created to generate as much energy as possible.

Too much radioactivity is dangerous, damaging cells and DNA whether the source is natural radon gas or a nuclear weapon. But it’s not all bad. Some people regard plate tectonics as a pre-requisite for life on earth. It certainly makes things more interesting. Plates move because the mantle convects because it needs to release heat to the surface. This heat comes partly from radioactive decay within the earth – without it this planet would be a cold and dull lump by now.

Fossil fission

Radioactive decay is massively useful to geologists as a dating tool. Rates of decay, usually expressed in terms of half-lives, are constant. If you can work out that a grain of zircon started out with twice as much Uranium-235 as it now has, then you know it formed 703.8 million years ago.

Let’s turn that round: 703.8 million years ago there was twice as much Uranium-235 around as there is now and therefore four times as much 147 million years ago. This means that the earth used to be hotter (more radioactive decay), which is why Archean geology is so weird (odd komatiite lavas, crust that dripped back into the mantle). It also means that fission reactions were easier in the past.

Much of the hard work of a nuclear weapons program involves enriching Uranium. From the Manhattan Project through to the Iranians today the most laborious job is taking natural Uranium (a mixture of Uranium-235 and Uranium-238) and increasing the proportion of Uranium-235. This is important because U-238 is more stable, with a longer half-life and less interest in breaking up. Humans increase the proportion of U-235 using centrifuges, or lasers, but a time-machine would do the same job.

Around 2 billion years ago, a Uranium-rich deposit in modern day Gabon was the site of seventeen natural nuclear fission reactors. Self-sustaining nuclear reactions, moderated by groundwater, lasted for about a million years. There are two excellent blog posts that cover the site in more detail.

Such natural reactions are extremely unlikely now, since much more U-235 has decayed into lead over the intervening 2 billion years. But what about the 2 billion years of earth history before the Gabon reactors started up? Were fission reactions active in that time frame? Some argue that they were, with explosive consequences.

Huge explosions and the moon

The deep Earth is a mysterious place. We know that the crust is relatively rich in radioactive elements but we don’t know much about their distribution in the mantle. One day Neutrino detectors may help map out the modern day distribution. How they were distributed earlier in the earth’s history is anyone’s guess.

Some people’s guesses (informed by computer modelling) suggest that heavy radioactive elements such as Uranium,  Thorium and Plutonium, sank to the bottom on the mantle, near the core-mantle boundary.  Plutonium is now regarded as a man-made element, but it would have existed in the early earth, as it would have had less time to decay since being created in a supernova. Geochemical models suggest that while substantially enriched, the average concentrations would still be too low to cause fission reactions.

Dutch scientists (R.J. de Meijer and W. van Westrenen) have suggested an amazing thing. Their theory is that concentrations of radioactive elements were higher in some areas than others (not unreasonable). They suggest that, just as human nuclear bombs are triggered by using conventional explosives to pressurise the radioactive material, a major impact on the earth would send shock waves into the inner earth and compress the material enough to initiate a nuclear reaction.

This reaction would take place in a large volume of rock and so would be create a huge explosion. Big enough, their modelling suggests, to fragment the earth and send lots of material into space. In time, some of this material formed a large moon orbiting the earth – the one we see today.

The moon? Really?

I suspect you are feeling a little sceptical right now, which I think is the right reaction. But bear in mind that we don’t really know how the moon formed. The best available theory is based on the idea of a massive collision with another large body. This has big problems because of the many isotopic similarities between the earth and moon. Any other body coming in would be expected to have had a different composition, traces of which would be present in the moon today.

The giant impact model is still the best. A recent conference on the moon’s origins discussed many ways in which the similarities between earth and moon could be reconciled with the model. The impact could have thoroughly mixed the material, or maybe the impactor had the same composition. Perhaps the moon originally came from Venus. We don’t know anything about the composition of Venus – it may be very similar to earth.

As far as I can tell, nobody discussed the nuclear explosion model at this conference. This may be because there is no actual evidence for it, just inference from modelling. In their latest paper R.J. de Meijer and W. van Westrenen predict distinctive patterns in Xenon and Helium isotopes in lunar material. Measurements of these elements on our current Apollo samples are contaminated by the solar wind, so samples of deeply buried lunar material would be needed to test it fully.

We’ll have to wait then. Perhaps some future lunar rover will dig up the required samples. If it does, it is likely like the Chang’e rover currently on the moon to be powered by Plutonium. Useful stuff, radioactivity.