What drives plate tectonics?

In the previous section we described how plate tectonics controls many things on the earth both today and in the past. Here we’ll describe the forces that drive the movements of plates, the patterns of how plates have moved and how computer modelling lets us understand the links between the deep mantle and the surface plates.

The earth is affected by gravitational forces from the sun and the moon. These move huge volumes of water every  day, causing the oceanic tides. They even cause small (but measurable) changes to the shape of the earth, the surface moving up and down by a few centimetres. As the earth and moon rotate quickly, these movements are quick and elastic, meaning the earth returns back to its original shape. It’s like a tall building swaying in the wind or during an earthquake. Elastic changes are where atoms move apart from each other, but the bonds within the material are not broken. Plate tectonics is like the entire building is moving, a permanent change caused by rocks slowly flowing or breaking.

Forces caused by plates

There are broadly two sets of forces that move the earth’s plates: those created by the plates themselves and those involving interactions with the mantle below.

Plate tectonics requires plates to be rigid and deform at the edges, they are strong enough that a force acting on one part of the plate pushes the entire plate. There are two sets of forces created at the edge of oceanic plates, one where they are created and another when they destroyed.

diagram of ridge push http://www.columbia.edu/~vjd1/driving_forces_basic.htm>

Ridge push is a force created at mid-ocean ridges where the flowing mantle (asthenosphere) rises up towards the surface. This occurs because the reduction in pressure allows melting and reduces the density of the material. As oceanic lithosphere (oceanic crust plus the stiff mantle material fixed to it) moves away from the ridge it cools and sinks as its density increases. This causes a slope and gravity acting on the higher ridge causes a horizontal force that pushes the entire plate horizontally. Some scientists calculate that a lot of the force pushing India into the Eurasian plate (creating the Himalayas) comes from the many ridges in the Indian ocean pushing on the plate.

Slab pull is a force associated with subducting oceanic lithosphere. Old cold oceanic lithosphere subducts because it’s denser than the surrounding mantle, therefore this negative buoyancy causes a force pulling on the edge of the plate. As it sinks it heats up, but also it is put under increasing pressure from the rock above it. This starts to drive metamorphic reactions that change minerals in the rock into different ones, more stable under the new conditions. Generally minerals with more compact, denser mineral lattices are stable and so the density of the rock is increased. The first transformation is called eclogitisation, but some oceanic plates reach the middle and lower mantle and so will undergo multiple transformations. 

We get a sense of the strength of this force by considering how these transformed subducted rocks – eclogites – reach the surface again. Eventually any subduction zone runs out of oceanic lithosphere, and the thin leading edge of the attached continent is pulled into the subduction zone where it is transformed at depth into eclogite. Contintental crust is much more buoyant and thicker than oceanic and resists subduction, meaning that subduction eventually stops. The deeper subducted oceanic lithosphere is pulling the other way and eventually it breaks in two. Once the force of the sinking oceanic lithosphere is removed, the buried edge of the continent, together with a stub of oceanic lithosphere, is quickly pulled back to the surface – bobbing back up like a balloon under-water.

The flowing mantle

Slab pull and ridge push are together one set of forces that act once plates are moving.  In addition forces will push onto plates from the convecting mantle below.

Convection is a physical property of bodies that can flow and are hotter below than above. Hotter material  is less dense than cool, so rises up and is replaced by cooler sinking material. You can see this sometimes in cooling soup, where patterns of flow affect the surface. 

Within the earth, sinking oceanic slabs will drag mantle material down with it and so become the downward flow part of convection. Similarly mid-ocean ridges are places where heat is released from the mantle and may correspond to an upward flow. However evidence from volcanic islands such as Hawaii suggests that mantle flow is more complicated than that. Most earth scientists believe in the existence of mantle plumes, long-lived flows of hotter mantle up towards the surface. The track of a mantle plume across the Pacific explains the pattern of the Hawaiian Islands. A mantle plume that caused volcanic activity in Greenland and the British Isles when the North Atlantic Ocean opened 60 million years ago is still active under Iceland, making that portion of the mid-Atlantic ridge above the surface.

These plumes appear to be unaffected by the passage of plates above them, and some scientists regard them as being fixed in location within the earth, being deep-seated structures. 

Seeing the effects of mantle convection on the surface movement of the plates is difficult. There are places on the earth, such as southern Africa which are much higher than we would expect. It seems that this is an area of upward mantle flow and this force is raising up the African continent, forming the high plateau that covers much of South Africa.

Supercontinents

Plate tectonic movements in the past show patterns where continents joined together into supercontinents, only to split apart again. The most famous supercontinent is called Pangea and it existed 270-200 million years ago. It contained all modern continents joined together. It’s breakup led to the creation of the continent shapes we are familiar with today. The Atlantic split apart the Americas from Europe and Africa. India, Antarctica and Australia were split apart by the creation of the Indian ocean. Also the Tethys ocean closed sending India colliding into Eurasia. 

Map of Pangea showing modern plate boundaries on it. Like https://www.worldatlas.com/articles/what-is-pangea.html. There are some wonderful examples on http://www.earthdynamics.org/earthhistory/Learn%20About%20Palaeogeography.html

Pangea formed late in the earth’s history. Before it the continents were separated from each other, but by different oceans that are now totally lost (the oceanic plates are now down in the mantle somewhere). We can trace the lines of the lost oceans by the traces of the collision when they formed or by patterns of fossils. Also slices of them called ophiolites may be found, lost within the centre of continents.

The line marking an ancient ocean can be found in countries around the North Atlantic. Called Iapetus, the join where it once was is often close to the modern Atlantic. By painstakingly  tracing traces of ancient oceans, combined with computer modelling, scientists have discovered other supercontinents older than Pangea. These are from times so far back that the shapes and names of continents are unfamiliar, but the processes are the same. Up to 13 supercontinents have been identified and named, going right back to earth’s earliest rocks. They appear to form and break-up at intervals of a few hundreds of millions of years. 

Whether or not the earth’s continents are all joined together or split into different parts affects many things. Continental shelves are great places for life, creating large areas of shallow water. If all continents are joined together, there is less continental shelf for creatures to live on. Cycles of supercontinent creation and break-up have been linked to changes in climate, patterns of the evolution of life, creation of continental crust, formation of ore deposits and many other things. 

Breaking up continents is not easy as continental lithosphere is stable and strong. The break-up of supercontinents seems to be linked to mantle plumes. A plume rising above a continent will heat it and push it up. Mantle flow away from the plume will start pulling the plate apart and the heat and volcanic activity make it easier to break. Some theories suggest that a supercontinent insulates the mantle below and eventually causes a hot plume to rise beneath it. This would explain why supercontinents form and are destroyed again and again in earth history.

Computer modelling goes “beyond plate tectonics”

The only real way to understand the complicated patterns of flow in the earth is by using computer modelling. Only computers than track the different types of force and the fact that this is all happening on a spherical earth. They can be used to try and bring together the theory and the real-life observations to reproduce patterns of plate tectonics over the history of the earth.

In building the models, scientists can use a lot of equations that describe the physics of how hot rocks flow – how they deform and how convection works. They also ensure that all the forces balance, that the earth remains the same size and that the surface plates are not spinning around the world. 

Into this theoretical model they add all the observations that led scientists to produce the theory of plate tectonics in the first place. Geological evidence of continental drift shows when continents were joined or moved apart. Magnetic stripes show how ocean basins opened, seismic tomography can see ancient subducted plates and help calculate where subduction zones were in the past. Techniques like palaeomagnetism show what latitudes rocks were at in the past.

Computer models now include all of this information and link it together in a consistent way. These models can describe both the movements of tectonic plates and patterns of ancient mantle plumes. Some say this is moving beyond plate tectonics and into a deeper understanding of how the entire earth works, not just the surface.

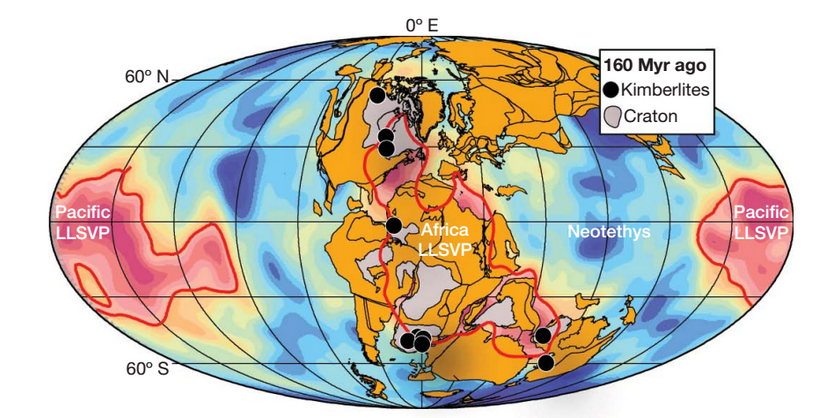
One example of the power of these models comes from studies of the distribution of diamonds at the surface of the earth. Diamonds form deep within the mantle, potentially over much of the earth, but they only come to the surface in particular places. Diamonds reach the surface within special types of volcanic eruptions called kimberlites. These are only found in very old parts of continents in Africa, North America, Australia and Asia. Deep under old continents, there is a thick and stable layer of cold and strong mantle attached to the crust. Kimberlites form when this old material is heated and molten rock rich in carbon dioxide is formed. This super-light material quickly shoots to the surface containing fragments of mantle rock within it, sometimes with diamonds. Computer modelling of past plate movements suggested that kimberlite eruptions occur when old continental lithosphere is heated by mantle plumes rising from below. Furthermore, mantle plumes tend to rise from the edges of mysterious structures at the core-mantle boundary called LLSVPs.

<<example of results of this modelling. first diagram in https://www.pnas.org/content/111/24/8735/tab-figures-data

This particular research is fairly recent and like most new studies is not accepted by all scientists. But it illustrates the power of these computer models. If it correctly explains where and when kimberlite eruptions occur, it could help mining companies find new kimberlites and so find new diamond mines.

These computer models are never complete. Scientists using computer modelling of complex systems like climate or the earth’s interior joke that all models are wrong, but the best ones are useful. They understand that new research will improve on existing models, but ones today can increase our understanding and suggest new areas of research.

First publication by Xiaoduo Media in Front Vision. Front Vision is a Chinese online science magazine for children. My original English text produced with permission.

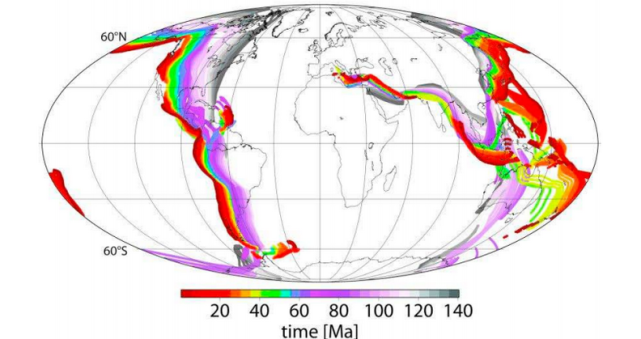
Plate tectonics

Deep in the earth, solid rocks can flow, but the surface layers are cold rigid plates that move across the surface. This means that continents are constantly drifting across the earth and oceanic crust is being created and destroyed.

Plate tectonics is one of the most successful scientific theories of the Twentieth Century. It explains the major structures of earth’s surface and interior, the distribution of earthquakes and volcanoes, location of coal and mineral deposits, even where we find different types of fossil. 

With modern global positioning satellite technology, we can directly measure the movements of the plates. They move about the speed your fingernails grow, a few centimetres a year. This isn’t fast on human time-scales, but on geological time-scales it means things are always changing. A geographical map of the earth from 100 million years ago looks very different and from 500 million years it’s unrecognisable. This is still only about 11% of the earth’s history.

Wegener’s theory of continental drift explained geological evidence from continents very well, but by the end of the 1950s it still wasn’t fully accepted for two main reasons. Firstly scientists knew the deep earth was solid but didn’t yet realise that hot solid rock can flow. Secondly our understanding of the rocks under the deep oceans was very limited.

Discovery of sea-floor spreading

During the second world war, new technologies were developed to measure the earth’s ocean depths as a way of detecting enemy submarines. After the war the US Navy funded surveys of the ocean depths to continue this work. Marie Tharp, a scientist working in the USA was involved in mapping out data from these surveys. In 1952 her mapping she identified a huge ridge down the middle of the Atlantic Ocean with a narrow valley at the very top. She interpreted this as a place where the earth was moving apart and linked it with the then controversial theory of continental drift. 

Many didn’t believe her, but soon huge quantities of data were collected confirming her idea. The surveys of the ocean also measured the earth’s magnetic field, as the Navy hoped it would help with detecting steel submarines. These data showed a clear pattern of stripes parallel to the mid-ocean ridges identified by Marie Tharp. 

Rocks cooling on the sea-floor contain magnetic minerals that capture a record of the earth’s magnetic field. This affects modern measurements of magnetism made above the rocks. The stripes are explained because the earth’s magnetic field changes back and forth over time (the Poles switch round). As crust is gradually created at mid-ocean ridges and drifts apart it slowly records the changing magnetic field. 

DIAGRAM SHOWING SEA-FLOOR SPREADING https://en.wikipedia.org/wiki/Vine%E2%80%93Matthews%E2%80%93Morley_hypothesis

The idea of ‘sea-floor spreading’ and that these mid-ocean ridges were creating new crust was developed in the early 1960s. For the Atlantic it was shown in 1965 that if you remove these stripes one by one and bring the two sides back together, the continents fit closely together. In plate tectonic theory these types of boundary where plates are moving apart are known as divergent. Mid-ocean ridges are not straight lines, but are offset by breaks in the oceanic plates called transform faults. The ridges are not just found within the Atlantic, but also within the Indian and parts of the Pacific oceans.

Discovery of subduction zones

In the 1960s governments invested in a world-wide network of seismometers as a way of tracking underground nuclear tests. The data captured transformed our understanding of the earth as it greatly increases our understanding of earthquakes happen.

Earthquakes are formed where rocks break and move along large surfaces called faults. Earthquakes in the Atlantic are focused on the mid-Ocean ridges, caused by the stretching and movement of rocks in the rift zone.  But the places where earthquakes are most common and strongest are found not in the Atlantic but around most of the Pacific and mark not where crust is made but where it is destroyed.

The earth isn’t growing bigger, so if oceanic crust is being made in the Atlantic, it must be being destroyed elsewhere. The Pacific oceanic plate is surrounded by subduction zones where lithosphere (oceanic crust plus attached mantle that together forms the plate) sinks down into the earth’s mantle. These are a type of convergent plate boundaries. At the surface subduction zones can be recognised by deep trenches formed where the oceanic lithosphere bends down. The Marianas Trench is the deepest, but they exist all around SE Asia and also down most of the west side of the Americas. 

As the oceanic lithosphere sinks into the earth there are sudden slips and jolts as it pushes its way down which cause large earthquakes that are very dangerous. Once scientists had enough data, they could see in the patterns of earthquakes the location of the plate as it sinks into the earth. The earthquakes were shallow near the trench and deeper further away forming a surface of earthquakes known as a Wadati-Benioff zone.

<<< Diagram of earthquakes coloured by depth. E.g. http://www.isc.ac.uk/ home page >>

This surface marks roughly the top of the oceanic plate and earthquakes form as it forces its way deep down into the earth. As it sinks it also heats up and water within the plate is forced out into the mantle above, which melts causing volcanoes at the surface.

diagram of subduction zone, e.g. https://en.wikipedia.org/wiki/Subduction

Volcanoes exist all around the Pacific, the so-called ‘ring of fire’, from New Zealand, through the Philippines, Japan, Alaska, Canada, USA and down through central and South America. Armed with a global set of data on earthquakes, scientists were able to trace subduction zones across the world and in turn show that the ring of fire volcanoes all sit above them.

In the early 1950s, Marie Tharp was not  believed as continental drift was so controversial. But by 1967 the ‘plate tectonics revolution’ was complete. In that year, models showing the earth’s surface as 12 rigid plates moving across the surface were published. These explained all of the features and evidence we’ve mentioned so far in a consistent and powerful way. Plate tectonics theory now underlies all of modern Earth Science.

https://en.wikipedia.org/wiki/Plate_tectonics#/media/File:Plates_tect2_en.svg

Plate tectonics around the world

 Looking at a map of plates and a topographical map of the world together is very interesting. Let’s go on a tour of the world and show how plate tectonics explains many things.

The south-western edge of Indonesia is a lovely example of a subduction zone. It has a deep trench, a clear Wadati-Benioff zone and a line of volcanoes that form the islands of Indonesia. This subduction zone caused an earthquake that in turn created a tsunami in December 2004 that killed 227 thousand people in 14 countries. The Australian plate is being subducted under a corner of the Eurasian plate but oceanic crust is also being created in a ridge down the middle of the Indian Ocean. 

Patterns of plate movement are complicated. The earth is a sphere and plates are rotating on it, meaning that relative plate movements are different in different places and don’t necessarily make sense on a flat map. In the USA the Pacific NorthWest has subduction and volcanoes where the tiny Juan da Fuca plate is being subducted. But nearby in Southern California the plates are moving past each other (a transform plate boundary) so there are earthquakes but no volcanoes. The city of San Francisco was destroyed in 1906 by an earthquake on this plate boundary.

In some subduction zones the sediment sitting on top of the oceanic crust is scraped off and piles up above the subduction zone in a structure called an accretionary wedge. In the Caribbean the West Indies consists of two types of islands. First there is a curved line of volcanic islands stretching from Anguilla down to Grenada caused by subduction of the Atlantic under the Caribbean plate. The island of Barbados is linked to these islands culturally but sits further east. It’s is not volcanic but is a place where the accretionary wedge forms an island. 

In some subduction zones oceanic lithosphere is sinking down below a different piece of oceanic lithosphere, rather than continental. Here the volcanoes form chains of islands and sometimes build up thick piles of crust called volcanic arcs. A lovely example of an arc of volcanoes is found in the Aleutian Islands in the North Pacific. 

Eventually oceanic islands and arcs enter a subduction zone where they are far too thick to be subducted. They are scraped off and added to the other plate in a process called accretion. Japan and Alaska are both places where volcanic arcs have been added to continental crust multiple times in the past. This process is one way continental crust may be created.

Continental tectonics

Continental crust is very different from oceanic crust. All land on earth sits on continental crust, with the exception of volcanic islands like Iceland or Hawaii. It is different in composition, being much richer in Silica. It has a lighter density and is never subducted. It is not involved in sea-floor spreading or subduction, but it is affected by plate tectonics and not just because continents drift across the surface.

Continental crust is affected by all three types of plate boundary. The East Africa Rift is where a divergent plate boundary is being started. Two parts of Africa are being pulled apart, with the continental lithosphere being thinned and volcanic activity occurred. Within about 10 million years this will become a true plate boundary and oceanic crust will start forming in the wider rift as the fragments of continent completely break apart.

Transform plate boundaries are found in California, but also down the middle of the South island of New Zealand. Convergent plate boundaries involving continents are of two types. The western edge of South America is an example of oceanic crust converging with continental, where subduction causes volcanoes but also a large mountain range called the Andes.

Plate boundaries where two continents converge cause large mountain ranges. There used to be an oceanic plate called Tethys sitting between what is now the Eurasian plate (to the north) and the African and Indian plates. After this oceanic crust was fully destroyed, continents collided forming mountain belts. The Himalayan mountains were formed by India colliding into the Eurasian plate and the Alpine mountain chain in Europe, plus mountains in Turkey, Iraq and Iran from Africa hitting Eurasia. The Tethys oceanic crust was a complicated shape and some of it remains within the Mediterranean sea.  

Plate boundaries within continents are not sharp or simple. The effects of the impact of the Indian and Eurasia plates extends all the way through China into Siberia. Plate tectonics describes rigid oceanic plates with sharp boundaries very well. Sometimes the term continental tectonics is used to describe the different ways in which continents behave.

At the same time as evidence to prove plate tectonics was building up, some scientists were thinking about how this theory could explain the earth’s history. They started to interpret old rocks in terms of plate tectonics. Big differences in fossils from locations now close together can indicate that an ancient ocean once existed between them. Slices of oceanic crust, known as ophiolites can be found within continents and also indicate where a now vanished ocean basin once was. Patterns of metamorphic and igneous rocks can also be used to trace ancient subduction zones (blueschist and eclogite rocks), volcanic arcs or contintental collision zones. 

A geologist called Tuzo Wilson proposed the idea of a regular cycle, where oceans open and close again and again. Close around the edge of the North Atlantic, in both Europe and America there are the traces of an ancient continental collision zone called the Caledonides that marks where a now vanished ocean called Iapetus was destroyed. Some time in the future the Atlantic ocean will close and another collision zone be formed close to the old one.

Plate tectonics explains the modern earth very well and explains most of the earth’s history too. Modern research into plate tectonics looks to explain where it may or may not apply, for example on other rocky planets and the very early earth. 

Mars and Venus are similar to earth in many ways, but neither have plate tectonics. The explanation may be simple: Mars be too small and cold for the rocks to mantle to flow properly. Venus may be too hot – it’s atmosphere is really effective at insulating the planet. Other explanations talk about the importance of water as a way of lubricating the subducting oceanic plates.

Another debate is around when plate tectonics started on earth. The early Earth had an internal temperature that was much hotter. For oceanic crust to subduct, it must be rigid enough to be pushed into the mantle and so if crust and mantle are hotter (like Venus now or the Earth in the distant past) then plate tectonics may not be possible. Instead blobs of crust sink down and hot plumes rising up are much more important. Rocks older than about 2.5 billion years old are different in many ways from those created now and maybe earth then was more like Venus now. Scientists are still debating these topics.

First publication by Xiaoduo Media in Front Vision. Front Vision is a Chinese online science magazine for children. My original English text produced with permission.


Beyond plate tectonics

Plate tectonics is the core unifying concept that has underpinned our understanding of the solid earth for over 50 years. To describe your research as moving “beyond plate tectonics” is quite a claim, but Trond Torsvik and the group he leads have some remarkable science to back it up. By tracking the movement of the earth’s plates over half a billion years they trace the effects of hot plumes of rock rising from the edges of structures sitting just above the earth’s core. Their research seeks to explain the origin of diamonds, immense volcanic eruptions linked to mass extinction events, the break-up of continents and how shifts in the earth’s axis caused glaciation in Greenland.

Dance of the plates

Trond Torsvik is a Norwegian scientist with a background in palaeomagnetism – studying fossils of the earth’s past magnetic field frozen in rocks – to trace the past locations of continents. Palaeomagnetism can tell you the latitude at which an ancient rock formed1. Torsvik worked with those in other disciplines – palaeontology and geology – to trace the slow joining and splitting of ancient continents.

This research (which involved many other scientists) has given us a pretty good view of how the earth’s plates moved around over the last 500 million years. But these movements are only the surface expression of the flow of the underlying rocks, the earth’s mantle. Now, as director of the Centre for Earth Evolution and Dynamics at the University of Oslo (CEED) Torsvik seeks to produce an integrated understanding of deep mantle flow – mantle dynamics – and how it drives plate tectonics and other surface processes.

Undoing subduction

The earth’s mantle convects. Although made of solid rock, over geological time-scales it flows like a liquid and we understand the physics of this process well enough to produce computer models of it. One important factor is subduction – as oceanic crust cools it sinks back into the mantle, changing the patterns of flow.

Based on our understanding of how the continents moved in the past, the CEED group (Bernhard Steinberger in particular) have calculated where ancient subduction zones were and therefore where the subducted plates ended up in the deep earth. These models of ancient mantle flow and subduction link our surface observations with deep-earth processes.

The diagrams below show how subduction zones have moved over time. The outline of the continents is fixed, representing a stable reference frame. The coloured lines show how subduction zones at the edges of plates have moved over time2.

The red lines correspond to modern subduction zones, but the colour coding shows how where they used to be in the past. Note how the western edge of the North America plate has moved east over time3. Also note how it shows the subduction zone that used to exist north of the Indian plate and which ceased around 60 million years ago as India and Asia collided (as the oceanic plate in between was completely subducted).

Steinberger, B., & Torsvik, T. (2012) figure 2b

Steinberger, B., & Torsvik, T. (2012) figure 2b

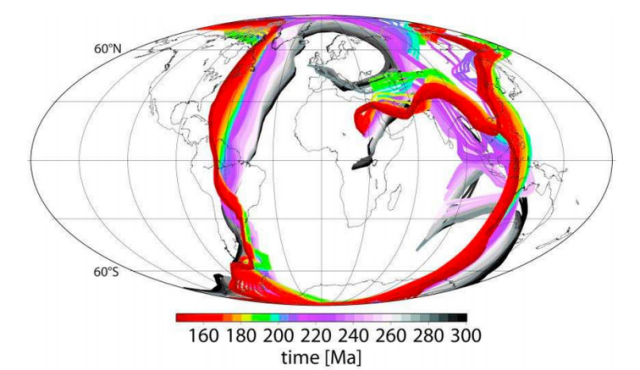
Here we have the same picture, but starting from 140 million years ago and moving back to 300 million years ago, the beginning of the Permian. These are the subduction zones that surrounded the ancient continent of Pangea.

Steinberger, B., & Torsvik, T. (2012) figure 2a

Steinberger, B., & Torsvik, T. (2012) figure 2a

The diagrams aren’t showing it directly, but they remind us that the oceanic crust that passed through these subduction zones is still down there in mantle; imagine the series of coloured lines as sheet descending down into the earth – that is a rough image of what is down there.

Deep structures affect the surface

Mantle plumes have long been suggested as the cause of chains of volcanic islands (like Hawaii). Many believe the concept has been overused and that some proposed plumes don’t exist – this is a controversial area.  Torsvik and CEED have taken the debate forward by presenting a testable hypothesis – that big plumes form around the edge of structures at the base of the mantle and that this has been happening for hundreds of millions of years.

Seismic tomography shows mysterious lumps at the very base of the mantle. They are called Large Low Shear Velocity Provinces (LLSVPs) and one sits under Africa and another under the Pacific. They are probably patches of different composition, but no-one knows for sure.

The CEED group believe these LLSVPs haven’t moved for a long time, so they took their models of plate movements to show how surface features have moved over them over time. They also plotted the locations of unusual volcanic features called kimberlites and vast piles of lava called Large Igneous Provinces (LIPs). The diagram below shows an example from 160 million years ago – here they’ve plotted the ancient location of the continents, plus that of the LLSVPs (in red). Note that kimberlites are found where areas of craton (thick old continental plate shown as grey areas) are above the edges of an LLSVP. Kimberlites are the host rocks for diamonds, so this result is not of purely academic interest.

Torsvik, T., et. al (2010), figure 2

Torsvik, T., et. al (2010), figure 2

This pattern holds when the analysis is done for other periods in the past, also when looking at modern active hotspots. Put all the data together and the pattern is quite impressive. Note that kimberlites and hotspots are not shown in their current position4 but the continents are.

Torsvik, T., et. al (2010) figure 1

Torsvik, T., et. al (2010) figure 1

This is a startling result. The fit isn’t perfect (the white dots don’t fit the pattern) but nothing on this messy planet of ours ever is.

So why are LIPs and kimberlites associated with the edges of the LLSVPs? The linking factor is deep plumes, which interact with deep continental lithosphere to produce kimberlites (and bring diamonds to the surface). Big plumes cause LIPs and the one shown above around the location of modern-day St Petersburg is the Siberian Traps which caused the largest mass extinction ever know at the Permian-Triassic boundary.

Surface processes affect the deep earth

What links plumes and the edges of the LLSVPs? Think back to those diagrams of ancient subduction zones and those curtains of ancient oceanic crust sinking into the mantle. Modelling of mantle flow through time shows that the ancient subducted crust reaches the base of the mantle where it pushes up against the LLSVPs. The flow of heat from interior of the earth to the surface drives the hot material rising up through the mantle but the interaction between plate and LLSVPs provides plausible mechanisms to get plumes started – the sinking plate pushes on the edge of an LLSVP and creates domes that turn into plumes.

What I like about this work is that by presenting a clear mechanism and predictions of how the deep and surface earth work together it is eminently testable. If mantle plumes form at the edge of LLSVPs, how does this affect the chemistry of the molten rocks that reach the surface? Perhaps one side contains the LLSVP material and another not. Any new seismic tomography data can be compared with the computer models that underlie this research. Does this research give us a new way to find diamond deposits? Finding answers to any of these questions will either help confirm the hypothesis or take research in new and interesting directions.

Our wobbly world

So much science, so little time! But allow me to test your attention span a little more and talk about my favourite example of how research from CEED links the surface and the depths of this planet.

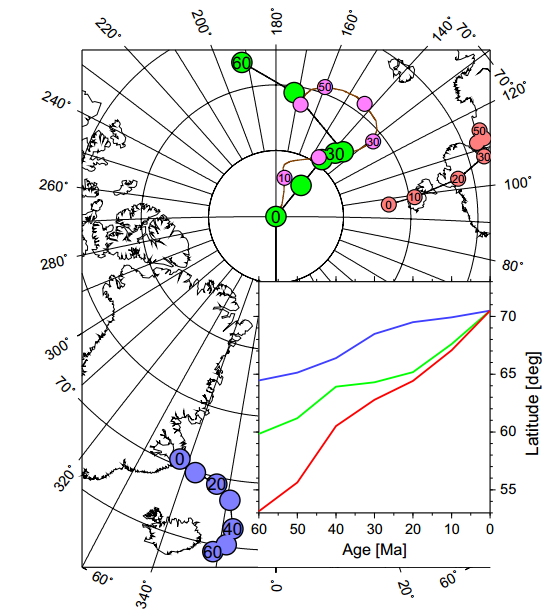
The presence or absence of ice on this planet is one of the longer-term climatic cycles observable in the fossil record. For all of the last half-billion years, glaciation has been restricted to the southern hemisphere – until the last few millions years. Climate is the major control over glaciation, but a paper this year points to three ways in which deep earth processes caused glaciation in Greenland to start.

Steinberger Terra Nova figure 5

Steinberger, B., et. al, figure 5

Firstly, Greenland is unusually high (and so cold) – this is because the deep plume now centred on Iceland thinned the Greenland lithosphere and, from five million years ago, fresh ‘plume pulses’ pushed it up. Secondly, standard plate-tectonics has caused it to drift north (blue points and lines in diagram) by 6 degrees. Thirdly and most mind-bogglingly, changes in the distribution of density of the earth’s interior have caused the earth’s pole of rotation to move closer to Greenland by 12 degrees (green points are observation, pink are theoretical calculations).

If you’ve ever pushed a barrel or ball part-full of water, you’ve some sense of what lies behind the third cause, known as “true-polar wander”.  Classroom globes have have a solid rod down the earth’s axis, but the real earth does not – it rotates around an axis called the ‘maximum moment of inertia’ that is determined by the distribution of mass within the planet. If this distribution of mass changes over time, then the axis changes and the poles shift to compensate. Modelling suggests that the shift of the north pole towards Greenland was caused by increased subduction under East Asia and South America.

Plate tectonics explains subduction. But models that show subduction tweaking the earth’s axis to bring glaciers or tickling the deep earth to create mantle plumes that can kill off nearly all life, break up super-continents, and send diamonds tinkling up to the surface. That really is going beyond plate tectonics.

References & image credits

This post is necessarily a skim over large amounts of complicated research. If you don’t believe it’s true, at least read the papers yourself. All are available online.

Source of images are in the image text. All either from open-source papers or produced under fair-use.

This Nature paper links LLSVPs, diamonds, plumes and LIPs.
Torsvik, T., Burke, K., Steinberger, B., Webb, S., & Ashwal, L. (2010). Diamonds sampled by plumes from the core–mantle boundary Nature, 466 (7304), 352-355 DOI: 10.1038/nature09216

This details the mathematical models linking subduction, LLSVPs and the initiation of plumes.
Steinberger, B., & Torsvik, T. (2012). A geodynamic model of plumes from the margins of Large Low Shear Velocity Provinces Geochemistry, Geophysics, Geosystems, 13 (1) DOI: 10.1029/2011GC003808

This links deep-earth processes to the onset of glaciation in Greeland.
Steinberger, B., Spakman, W., Japsen, P., & Torsvik, T. (2015). The key role of global solid-Earth processes in preconditioning Greenland’s glaciation since the Pliocene Terra Nova, 27 (1), 1-8 DOI: 10.1111/ter.12133

This contains the detail about true polar wander.
Steinberger, B., & Torsvik, T. (2010). Toward an explanation for the present and past locations of the poles Geochemistry, Geophysics, Geosystems, 11 (6) DOI: 10.1029/2009GC002889

The Constitution of the Interior of Earth, as Revealed by Earthquakes

How to tell if the loaf of bread in your oven is cooked? You can see the outside is nicely browned, but you can’t see the middle – is it doughy still? Give it a tap and listen. If it sounds hollow then it’s ready. The sound of the tap passes through cooked bread differently than through dough.

As with loaves of bread, so with the earth beneath us. Earthquakes give the earth a tap and we listen to the earth with seismometers, but the principles are the same. The sound and shaking caused by the tap passes through places we can’t ourselves get to and the way they are changed tells us about the material they’ve passed through.

Simple seismology

Every time an earthquake ‘taps’ the earth, it sends seismic waves whizzing off in all directions.  For those of us who live on the outside, the most dangerous types are those that travel along the surface, but we are interested here in body waves, the ones that travel through the earth’s interior. Imagine yourself watching a seismograph when an earthquake’s effects arrive1. The first set of twitches2 are caused by the arrival of the primary or P-waves. These travel fastest and work like sound waves – by compressing material in the direction of travel. Next arrive the secondary or S-waves which move forward while shearing material side to side (think of a slithering ssssnake).

What earthquakes can reveal

The first person to clearly identify P, S and surface waves on a seismogram3 was British scientist Richard Dixon Oldham. Born in 1858, he was child of the Empire. His father was Professor of Geology at Trinity College, Dublin. Following his father’s footsteps led him to the Geological Survey of India. Studying a 1897 magnitude 8.1 earthquake in Assam he spotted the distinct arrival of P, S and surface waves, due to their travelling at different speeds. What’s more, he linked these observations both to existing theory of how waves propagate in materials and to fault ruptures on the earth’s surface.

Ill-health took him back to Britain in 1903, where his research continued. In a lovely 1906 paper called “The Constitution of the Interior of Earth, as Revealed by Earthquakes” he showed what seismograms could tell you about the very centre of the earth.

In the introduction, he paints a picture of woe:

“Many theories of the earth have been propounded at different times: the central substance of the earth has been supposed to be fiery, fluid, solid, and gaseous in turn, till geologists have turned in despair from the subject, and become inclined to confine their attention to the outermost crust of the earth, leaving its centre as a playground for mathematicians.

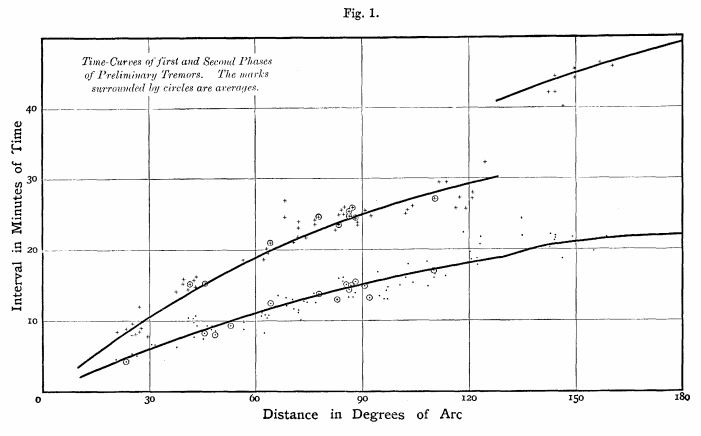
Taking data from a mere 14 earthquakes and similar number of stations, he plotted the interval between earthquake and wave arrival4 against distance in ‘degrees of arc’ (180 degrees of arc would be a wave that had passed directly through the earth to be measured at the point opposite the earthquake).

Figure 1 from Oldham (1906).

Figure 1 from Oldham (1906). The lower line is P-waves, the upper S-waves

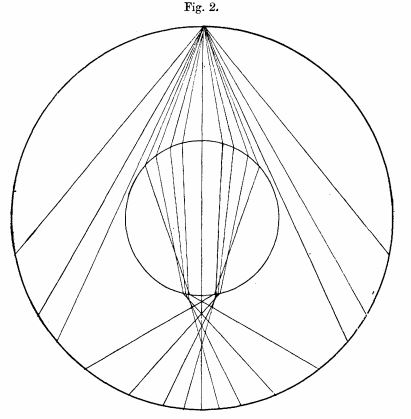
Oldham’s insight, rescuing the centre of the earth from the mathematicians, was to use the obvious change in the pattern at about 150 degrees to infer a core of very different composition from the surrounding material. A seismometer at greater than 150 degrees from the earthquake must trace rays that have passed through the deep earth – so the times it records tell us about the very core of the earth.

Figure 2 from the same paper.

Figure 2 from the same paper. Note how the paths taken by seismic waves are refracted by the changes in velocity at the core-mantle boundary

Oldham was confident that his data showed that “the central four-tenths of the [earth’s] radius are occupied by matter possessing radically different physical properties” and time has proved him right.

Seismology across the globe

Reading this paper is reminder that globalisation is not a modern phenomena. Oldham was drawing on recording stations from many place – not just from British Empire (New Zealand, Australia and South Africa) but also the Americas and the Russian Empire (Irkutsk, Tashkent and Tiflis). He refers to literature from Japan and papers written in both German and Dutch. The latter involved field work from the Dutch East Indies (now Indonesia).

While scientists across the world were communicating with each other, this was not necessarily done quickly. All the earthquakes he studied were between 12 and 4  years old.

A shadowy view of the inner core

As speculated upon by Oldham, but proved by others in the next few decades, S-waves don’t travel through the core, because it is liquid – seismometers on the opposite side of the earth don’t see an earthquakes S-waves as they are in the ‘shadow’ of the earth’s core. The patterns of refraction you see in Oldham’s diagram above mean that there is a shadow-zone for P-waves also.

In 1936, taking data from within the shadow zone of an earthquake in New Zealand, Inge Lehmann found waves that shouldn’t be there. Tracing their paths, she explained them by inferring a distinctive solid inner core that created more ways for rays to reflect and refract their way through (for more detail see this great write-up).

Seismic tomography

Seismic data can used for many things. Locating earthquake foci helps us trace patterns of faults across the globe and so better predict which areas of the surface are at risk. Making bangs at the surface and measuring the reflections from shallow sub-surface layers is a great way to find oil and gas. Using them to better understand the structure of the deep earth is known as global seismology, or seismic tomography.

The key principles of using seismology to study the earth’s interior were set in the early Twentieth Century. The time taken for waves to pass through the earth gives the speed they travelled, which tells you something about the properties of the material they passed through. Building up models of the interior of the earth allows you to trace the paths they took. Studying sets of paths that go through the same portion of the earth tells you something about the properties of that part of the earth.

Image of the deepest mantle from seismic tomography. Part of figure 7 from Steinberger et. al 2012. Used under CC licence. See reference below.

Image of the deepest mantle from seismic tomography. Part of figure 7 from Steinberger et. al 2012

Armed with millions of data points and highly sophisticated mathematical models modern seismologists are able to image the earth’s depths in detail, down to scales of a hundred kilometres. As well as understanding how things change with depth, they are also able to spot differences between different places at the same depth. The very base of the mantle in particular contains a lot of distinct areas with unusually low velocity.

Variations in seismic velocity at the same depth can be explained by variations in temperature or in composition. Either way, to explain the features seismology shows us, we need to bring some other sciences to bear. Let’s move to chemistry next.

References

Oldham R.D. (1906). The Constitution of the Interior of the Earth, as Revealed by Earthquakes, Quarterly Journal of the Geological Society, 62 (1-4) 456-475. DOI: http://dx.doi.org/10.1144/gsl.jgs.1906.062.01-04.21

Steinberger B. & T. W. Becker (2012). Subduction to the lower mantle , Solid Earth, 3 (2) 415-432. DOI: http://dx.doi.org/10.5194/se-3-415-2012