The Himalaya: mountains made from mountains

Good building stones get reused. Sometimes the only traces of very old buildings are their stones, built into more modern ones. It’s the same with rocks and mountain belts. Stone that now forms parts of the Himalaya was once part of a now-vanished mountain range.

The Himalaya were formed by the collision between the Indian and Asian plates. For 50 million years, the Indian plate has been pushed down into the Himalayas where it is squashed, mangled and changed by heat and pressure. Working out the details of this process of mountain building has taken decades of careful study. Modern isotopic techniques are now so powerful that researchers studying Himalayan rocks can peer through beyond the effects of the recent mountain building to see traces of older events.

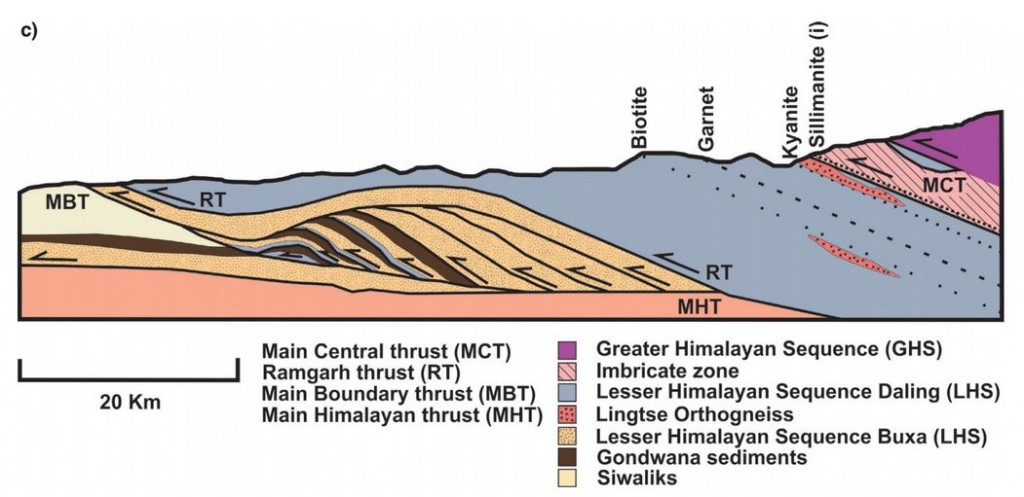
A recent open access paper by Catherine Mottram, Tom Argles and others looks at rocks in the Sikkim Himalaya, around the Main Central Thrust (MCT). As you can guess from the name (and the Use Of Capitals) this is an important structure; it can be traced over 1000km across the Himalaya and separates two distinct packages of rock known as the Lesser and Greater Himalayan Series.

Figure 2c. Cross section of MCT in the Sikkim Himalaya

Figure 2c. Cross section of MCT in the Sikkim Himalaya

As the rocks of the Indian plate were stuffed into the moutain belt, much of the movement of rock was along near-flat faults, known as thrusts. These stack up layers of rock, shortening and thickening the crust. Thrusts near the surface may be a single fault plane, but at greater depths rocks flow rather than snap and a thick thrust zone of deformed rocks is formed. This makes drawing a line on a map and calling it the Main Central Thrust rather difficult. Should the line be placed where the rock types change, or where they are most deformed, or where there is a break in metamorphism? Each approach has its advocates.

Our authors took an isotopic approach, measuring Neodymium isotopes for the whole rock and Uranium-Lead in useful crystals called Zircon. Their analysis shows that the two packages of rock separated by the MCT can be distinguished using isotopes. The actual boundary is not sharp: they prove interlayering of the two rock packages within the thrust zone, rather than a single boundary. This is not surprising given that thrusting is a gradual process and thrust surfaces are not flat.  Deformation seems to have started at the boundary between the Lesser and Greater Himalaya and gradually moved down over time.

The patterns of isotope measurements that can be used to distinguish between the Greater and Lesser Himalayan Series also tell us about what happened before India met Asia.

The zircons whose isotopes were measured are of two types, detrital and igneous. The first are grains that were eroded from old rocks and settled into a sedimentary basin. The second crystallised from molten rock: their ages record significant events. Together these sets of dates give a view of a long and complicated pre-Himalayan history.

Our authors attempt to reconstruct the leading edge of the Indian plate, as it might have looked before it crashed into Asia.
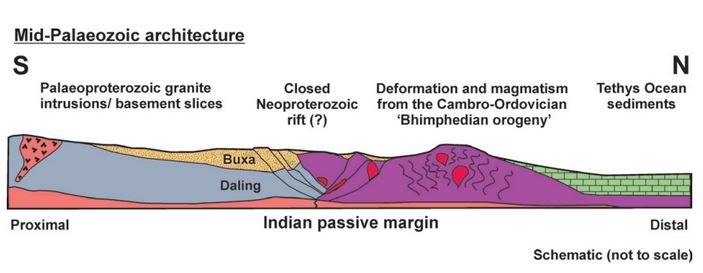
Figure 10.

Figure 10. “Schematic illustration showing the pre-Himalayan architecture of the Sikkim rocks, during the mid-Palaeozoic. The Lesser Himalayan Sequence lithologies were once separated from the Greater Himalayan Sequence rocks by a Neoproterozoic rift. The Bhimpedian orogeny was responsible for closing the rift and thickened the Greater Himalayan Sequence, causing metamorphism and intrusion of granites. The failed closed rift may represent a weak structure later exploited by the Main Central Thrust. Lithologies are the same as in the legend in Figures 1 and 2.”

The Greater Himalayan Sequence had already been heated and deformed in the roots of a mountain belt long before the Himalayas existed. This a relatively common situation. Polyorogenic rocks such as these1 need to be treated with care, otherwise we might mix up events separated by millions of years. A single garnet crystal may contain different areas that formed in totally separate mountain building events

One of the detrital zircon grains dated in this study was 3,600,000,000 years old. We can only guess how many cycles of erosion and burial, how many splittings and couplings of continents this mineral has ‘seen’. As it was buried and heated once again maybe, like the bowl of petunias in The Hitchhiker’s Guide to the Galaxy it thought to itself: “Oh no, not again”.

References

Mottram C.M., Argles T.W., Harris N.B.W., Parrish R.R., Horstwood M.S.A., Warren C.J. & Gupta S. (2014). Tectonic interleaving along the Main Central Thrust, Sikkim Himalaya, Journal of the Geological Society, 171 (2) 255-268. DOI:

Argles T.W., Prince C.I., Foster G.L. & Vance D. (1999). New garnets for old? Cautionary tales from young mountain belts, Earth and Planetary Science Letters, 172 (3-4) 301-309. DOI:

Seasonal flow of geological learning

‘Big data’ is the idea that the Internet provides organisations with an unprecedented amount of data that deserves new forms of analysis. The more general idea that sophisticated analysis of big data sets is important is quite topical, just ask Nate Silver.

Google have always been good at this sort of thing. They make (some) of their internal ‘big data’ publicly available for all of us to have a geeky play with. One example is Google Trends which shows (normalised) data for the volume of searching on particular search terms. They also split data geographically.

I’ve been playing around and there are some interesting patterns that suggest to me there is a seasonal flow of geological learning. Take a look at this.

[trend w=”600″ h=”400″ q=”Subduction” geo=””]

There is a clear seasonal pattern there. Searches are lowest in the Summer (July/August) and show a clear dip in December. The pattern holds for plate tectonics and other terms too.

[trend w=”600″ h=”400″ q=”continental+crust, oceanic+crust” geo=””]

It seems pretty obvious these correspond to term time in schools and colleges and that most searching for geological terms is done by students. Further evidence comes from Google Correlate, which shows searches terms that are correlated in time. Subduction searches in France and the US correlate with other terms that students with geological assignments are likely to type in.

Some geological words have other meanings of course, look at this.

[trend w=”600″ h=”400″ q=”quartzite” geo=””]

The peak in January confused me, until I looked at the related terms and found out about the large mineral fair in the town of Quartzite, Arizona in January every year. There is a peak for searches for ‘Mars’ in March which is related to that being the French word for March.

My examples are fairly trivial perhaps, but what staggers me is the potential of this sort of data. Another post I’m writing is about recent scientific research based on publicly available ‘big data’ (remote sensing and altitude data). There must be proper scholarship to be done using this Google Trends data, but for me its just an interesting diversion. I leave you with a puzzle, why is the seasonality of ‘photosynthesis’ searches so distinctive? What happens in October and November? Do thousands of biology teachers all start the academic year with the basics of plant biology?

[trend w=”600″ h=”400″ q=”photosynthesis” geo=””]

How old is plate tectonics?

Plate tectonics is the process that underpins much of our understanding of the Earth. It explains manymany aspects of the Earth, from magnetic patterns in oceanic rocks to the distribution of plants and animals. How unusual is it? Well, it doesn’t seen to be happening on other rocky planets in our solar system. Many geologists have argued that plate tectonics wasn’t active during the earth’s early history. As astronomers find many rocky planets in other solar systems, the question of understanding how ‘typical’ plate tectonics has implications beyond the earth. How long has it been going on – how old is it?

The Precambrian, is the span of earth’s history before the Cambrian. When geological periods were first defined, by largely-British geologists in the Nineteenth century, they were distinguished by the fossils they contained. Precambrian fossils are rare (hard shells only evolved in the Cambrian) and not until the Twentieth century could we calculate the absolute age of rocks. Precambrian rocks in Britain are fairly uncommon, mostly restricted to the Highlands of Scotland, so lumping them into one group made sense at the time.

Geological timescale clock from Wikipedia

Unfortunately, it turns out that the Precambrian covers the vast majority of earth’s history. Now that we can get an absolute age for many rocks, it’s possible to divide the Precambrian into smaller chunks. The next level of division consists of the (increasingly old) Proterozoic (“earlier life”), Archaean (“beginning”) and Hadean (“hellish”).

Precambrian rocks are often very different to modern ones. As well as the atmosphere being very different, the earth itself was hotter (younger radioactive isotopes give off more heat). Rocks like komatiite lavas which erupted at 1600 °C, far hotter than modern basaltic lava, suggest that mantle temperatures were then much higher. For this and other reasons, its often been assumed that plate tectonics was not active in earth’s early history.

A paper by Peter Cawood and two other Oz-based scientists called “Precambrian plate tectonics: criteria and evidence” (free!) addresses this question in a systematic way.  First they contrast plate tectonics and ‘plume tectonics’ as two different ways of transferring heat out of the earth. Both are active now (e.g. Hawaiian plume is a hotspot) but plate tectonics is dominant.

How to distinguish the two? One key difference, Cawood argues, is that plate tectonics involves “the differential horizontal motion of plates”. Plate tectonics is all about chunks of crust wandering about the place, so evidence of this is significant. How to track the ancient movements of the plates? Palaeomagnetology, or palaeomagic as it is jokingly referred to, is the study of earth’s ancient magnetic field. As magnetic minerals form, or cool down, they fix an impression of earth’s magnetic field within them. Heating samples in the lab allows us to measure the orientation of this fossil magnetic field or ‘palaeopole’. One way in which these palaeopoles can be useful is to tell you the latitude of the sample at that time. Plotting palaeopoles from different areas of Precambrian rocks at different times, Cawood demonstrate that they change latitude over time, both absolutely and relative to each other. If continents are drifting, then plate tectonics is responsible.

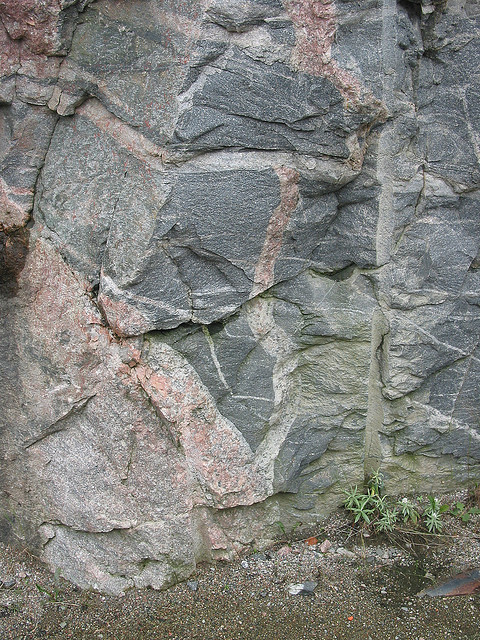
Greenstone Xenoliths in Archean Gneiss, near Sand River, Ontario

Greenstone Xenoliths in Archean Gneiss, near Sand River, Ontario, by Ron Schott: http://www.flickr.com/photos/rschott/303768298/sizes/z/in/pool-517016@N23/

Archean rocks often consist of distinctive granite-greenstone terranes that are not linked obviously to plate tectonic processes. Cawood lists evidence that while it may not be obvious, the link is there – in particular distinctive features such as ophiolites (slices of sea-floor on continents) and eclogites (very deeply buried metamorphic rocks) are increasingly being identified in very old rocks. Evidence from geochemistry and metal deposits is also brought to bare to argue that plate tectonics was active for most of the Precambrian and may have been active from the dawn of earth’s history. Precambrian rocks are distinctive, but the fundamental mechanism that drives the modern earth affected them too.

This paper is a great summary, but is not the final word (of course). Other scientists argue that plate tectonics wasn’t active and other processes were dominant. For example one groupuse numerical modelling and emphasise the importance of mantle temperature. If the mantle is too hot, then the lithosphere is weakened by melt and so not rigid enough to move as plate. An intermediate stage towards modern plate tectonics involves shallow underthrusting of oceanic lithosphere under continents. A very recent paper involving physical modelling of Archean crust provides an overview of alternative views. The paper focuses on explaining features of Granite-greenstone terranes such as “dome and keel” geometry in terms of channel flow. Channel flow is where soft squishy crust starts flowing sideways under pressure; today it happens (perhaps) only in thickened crust in mountain belts, like the Himalayas. In the hot Archean, it could have been a much more common process.

Whether or not the fundamental processes are the same, the Archean earth was very different to the planet we are sitting on now. It was frequently struck by large lumps of space debris, had a radically different atmosphere, no ‘visible’ life and weird geology. If we were suddenly transported to the Archean, we might (in the few moments before we suffocated) think we were on a different planet. When studying the remains of such a place, the uniformitarian idea that “the present is the key to the past” is stretched to breaking point. Understanding these extremely ancient rocks is very hard indeed, but it is one of the most interesting challenges in geology.

References

Cawood, P.A., Kröner, A., & Pisarevsky, S (2006). Precambrian plate tectonics: criteria
and evidence GSA Today DOI: 10.1130/GSAT01607.1

Open access link.

L.B. Harris et al. Regional shortening followed by channel flow induced collapse: A new mechanism for “dome and keel” geometries in Neoarchaean granite-greenstone terrains Precambrian Research 212-213 (2012) 139–154  Open access link.

Sizova et al., (2010) Subduction styles in the Precambrian: Insight from numerical experiments Lithos 116, 3-4  dx.doi.org/10.1016/j.lithos.2009.05.028Open access link.


Cycling in the Pennines – 300 million years ago

The north of England is dominated by rocks of Carboniferous age, which give it a distinctive scenery and history, where local coal fuelled the world’s first industrial landscape.

The geology is extremely well known, because of the importance of the coal deposits, but also because of the continuing excellence of the British Geological Survey. A recent paper shows how their deep knowledge allows them to identify and quantify cycles of sedimentation, some of which are less than 100,000 years in duration (a geological eye-blink).

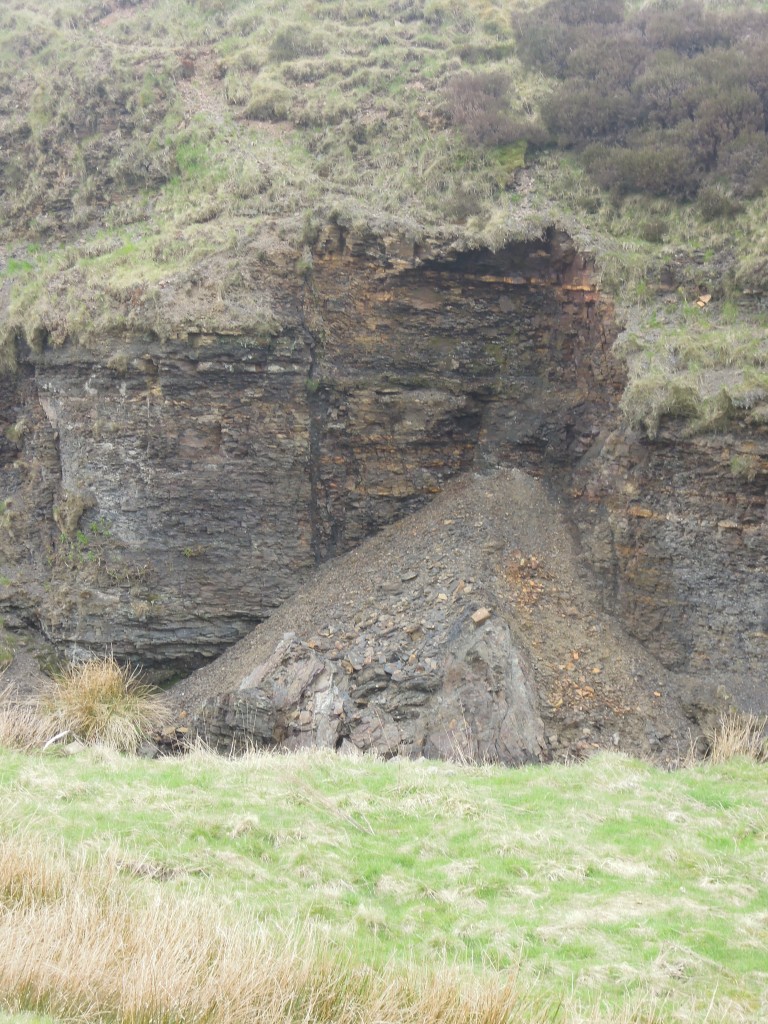
Carboniferous shale, Goyt's Moss

Carboniferous shale, Goyt’s Moss

Spotting the cycles

In an earlier post I’ve written about the rock types found in this area, the Pennine Basin of northern England, so here I’ll cover the broad geological context only.

The early Carboniferous in England was a time of extensive rifting, caused by plate tectonic goings-on further south. This created deep ‘gulfs’ in the grabens and shallow platforms between (horsts and grabens if you’re feeling German). All sedimentation was marine, mud in the gulfs and limestone on the platforms. By the mid-Carboniferous the extension had finished, but the thermal disruption it caused remained, meaning that cooling of the crust caused slow but constant subsidence through the rest of the Carboniferous. The mid to late Carboniferous (Namurian and Westphalian, in local terms) was dominated by shallow water,  mostly non-marine sedimentation. A time of rivers, deltas and coal swamps, all close to sea level.

Its long been noticed that they are regular sequences within these rocks. Coal deposits occur regularly and can be correlated from pit to pit for 10s of kilometres. In a similar way ‘marine bands’, thin layers of shale containing marine fossils, are seen again and again. These marine bands contain goniatite fossils (older relatives of ammonites) which evolve rapidly and can also be correlated from place to place. Often the marine bands are succeeded by coarsening-upwards sequences that move into non-marine rocks – in turn topped by another marine band.

As recently as the 1980s this regularity was explained rather feebly in terms of ‘avulsion of deltas’ or some such.  Even to this spotty teenager, it wasn’t a convincing story. When sequence stratigraphic concepts arrived soon after, they were a natural fit, particularly when marine bands were correlated across different basins in Europe, showing that the cause couldn’t be local.

There are extensive Carboniferous glacial deposits in many parts of the world. The idea that the waxing and waning of polar ice-caps has a major influence on sedimentary patterns across the world is now common place and it fits these rocks well. Melting of polar ice will cause flooding globally, putting marine mud on top of areas previously above sea-level – this was as true for the Carboniferous as it may be for the Anthropocene.

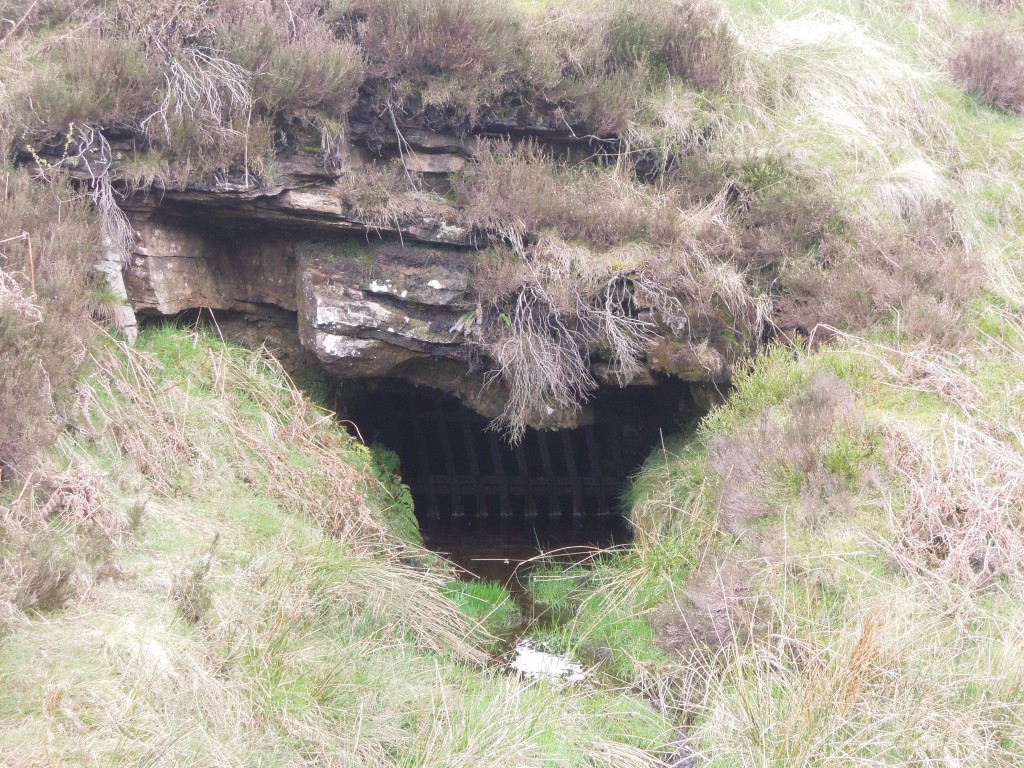
'Sough' a drainage tunnel from shallow coal mining, Goyt's Moss

Carboniferous sandstone. Note the ‘sough’ – a drainage tunnel from shallow coal mining, Goyt’s Moss

Measuring the cycles

In Nature and timing of Late Mississippian to Mid Pennsylvanian glacio-eustatic  sea-level changes of the Pennine Basin, UK Colin Waters and Daniel Condon of the British Geological Survey take a massive data set and use it to quantify how long these cycles of sedimentation took.

Sequence stratigraphy emphasises the identification of significant surfaces that correspond to significant changes in sea level. Sequence boundaries are associated with sea-level falls and parasequence boundaries with sea-level maxima. Waters and Condon link Pennine rocks to sequence stratigraphy: “The marine bands occur at the base of marine to non-marine upward-coarsening cycles, equating to the parasequence of the Exxon sequence-stratigraphic model“; marine bands are maximum flooding surfaces. They identify 47 of these and use current day areal extent to infer which ones represent bigger sea-level rises. Minor unconformities, where valleys have been cut into older sediments, can be linked to sequence boundaries – if sea-level falls then river channels will deepen. These palaeo-valleys are rather subtle structures, but they have been mapped out across northern England.

Waters and Condon start by looking at distinctive layers of mud with great names, one is a bentonite, the other a tonstein. These are layers of volcanic ash and they contain primary zircons, volcanic grains that lock in the age of the eruption. Analysis of these grains allows them to calculate accurate dates for when the layers were deposited.

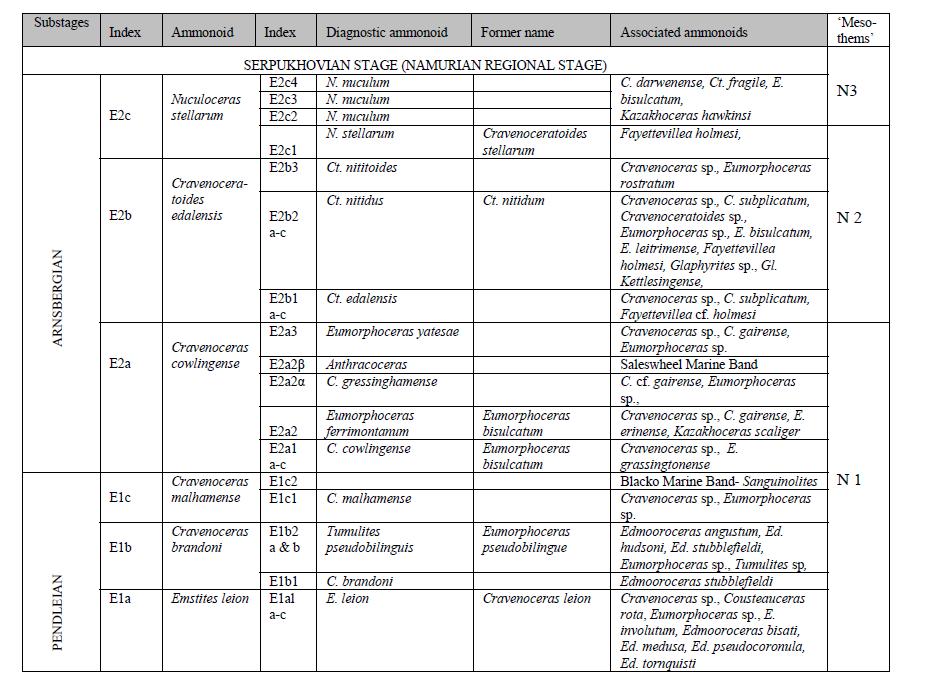
These dates are not just of local interest. Carboniferous rocks in Europe are correlated on the basis of marine fossils, such as goniatites in marine bands. From this, geologists create a biostratigraphy that allows you to know the age of a rock from the fossils within it. The ideal is a global biostratigraphy, but the nature of the fossils found in Carboniferous rocks makes this difficult.

Carboniferous biostratigraphic column from Waters and Condon

This section of the European biostratigraphy shows how fossils track the passage of time. Note there is no age on there. The rate at which new fossil species arise, or sediments are deposited, is not known. Dating a volcanic ash layer, which is found in a particular position in the biostratigraphy, allows you to put absolute dates against the table above, to start to build up a chronostratigraphy. There are other ways of linking the cycles in the sediments to absolute ages, as we shall see…

Understanding ancient cycles

Interpreting the patterns of rocks in terms of sequence stratigraphy provides further constraints on timing. Patterns of sea-level change are linked to changes in orbital obliquity (wobbles in the spinning of the earth) called Milankovitch cycles.  For the Carboniferous we expect long cycles of 413,000 years and shorter ones of 112,000 years.

Putting all these constraints together and using their massive data set, Condon and Waters build up a picture of how distant ice-caps controlled English rocks.

Starting with the big picture, they posit four major ‘ice ages’ for the period in question, each lasting approximately 1 million years.  The interglacial periods are associated with no paleo-valleys and few marine bands – sea level is fairly stable.

For the intervening rocks, they see two patterns in the marine bands. At times they follow a 400,000 year cycle, at others 111,000 or 150,000 years. The patterns of rocks in England are controlled by ancient wobbles in the earth’s rotation. This is an extraordinary thing. The link between the two is the ebb and flow of ice-caps half-way across world – in Geology sometimes it feels like absolutely everything is inter-connected.

For rare cases where multiple marine bands contain the same fossils, Condon and Waters infer these must be related to even shorter sub 100,000 year Milankovitch cycles. This is less well-proven as it is based on the assumption that the rate of change of goniatite species is relatively constant.

Although focussed on a small region, this research is interesting in many ways. Firstly it shows how stratigraphers use multiple lines of evidence to build up a picture of earth history. Condon and Waters put dates on the duration of the Ice Ages which are of use when studying rocks of this age anywhere on earth. Also it gives a taste of how aggregating data gives new insights; to map out the marine bands they drew on countless individual data points collected by the BGS over many years.

The work of stratigraphers is not glamorous but it is important. To build up a history of the earth’s history, knowing when things happened is vital.

References, other information

 
ResearchBlogging.orgColin N. Waters, & Daniel J. Condon (2012). Nature and timing of Late Mississippian to Mid-Pennsylvanian glacio-eustatic sea-level changes of the Pennine Basin, UK Journal of the Geological Society DOI: 10.1144/​0016-76492011-047

A late draft of this paper is available to you all via an open access portal.

Courtesy of the BGS, here’s a view of the geology of northern England.