 Why are some bits of the earth higher than others? Finding mountains near plate boundaries is easy to explain – various forms of plate collision cause the crust to thicken and the surface to rise. What about Southern Africa?
Reaching a high point of 3473m, most of Southern Africa is a high plateau. It is not tectonically active – the sedimentary layers in the photo are still horizontal – but they are more than a kilometre higher than they ‘ought’ to be. Why?
African swells and superswells
In recent GSL paper, Stephen Jones, Bryan Lovell and Alistair Crosby argue that the topography of Southern Africa can be explained by mantle convection pushing the crust upwards – that flow of the mantle has a direct influence on surface topography. They go onto argue that this phenomena also controls patterns seen in ancient sedimentary basins.
A spot of theory first. On the scale of 100s of kilometres topography is controlled by the properties of the lithosphere – the Tibetan Plateau can be explained this way. But over scales of 1000s of kilometres the lithosphere isn’t strong enough. On this scale, variations in height can only be explained either because the lithosphere is thicker, or because it is being pushed up from below.
Our authors look at Southern Africa and Antarctica, areas far from convergent plate boundaries. Studying the patterns of topography and gravity, they argue that the main geographic features can be explained by dynamic support from mantle convection. So the Drakensberg mountains (pictured above) are high because they sit above a portion of the mantle that is rising, pushing the plate (and the surface) up. The low-lying Congo basin, further north sits above a descending part of the mantle.
They paint a picture where “thousand-kilometre scale dynamically supported swell topography is the norm for continental regions that are not influenced by subduction zones“, suggesting that areas such as eastern Australia, peninsular India, central USA, east Africa, eastern USA, the Siberian Shield and eastern Siberia are all affected by similar long ‘topographic swells‘. The African swells they study in detail are around 2000km in diameter and between 1.4 to 2.7km in height.
This is a tremendously important idea, suggesting that the broad patterns of the landscape can be explained by slow movements of rock deep under the surface. Patterns of convection within the upper mantle subtly change the shape of the earth we stand on. More, there is talk of an Southern Africa superswell, over 10,000km in size. A long wavelength warping of the earth’s surface that the other swells sit on and which could be partly supported in the lower mantle.
One of the beautifully elegant things about earth sciences is the way we discover that apparently unrelated aspects of the earth are linked. Discovering such a linkage provides insights into both things simultaneously. So, discovering that topography is related to mantle convection gives you new ways of understanding both. For example looking at sedimentary sequences sitting on these African swells allows us to work out how long the swell has existed for (40 million years). This in turn is an insight into the timescales of convection within the mantle hundreds of kilometres under the surface.
To the UK
The concept of dynamic topography is not new to this paper, (there was a conference about it last year), it adds importantly to the debate by quantifying both modern day swells in Africa and ancient swells in sedimentary basins.
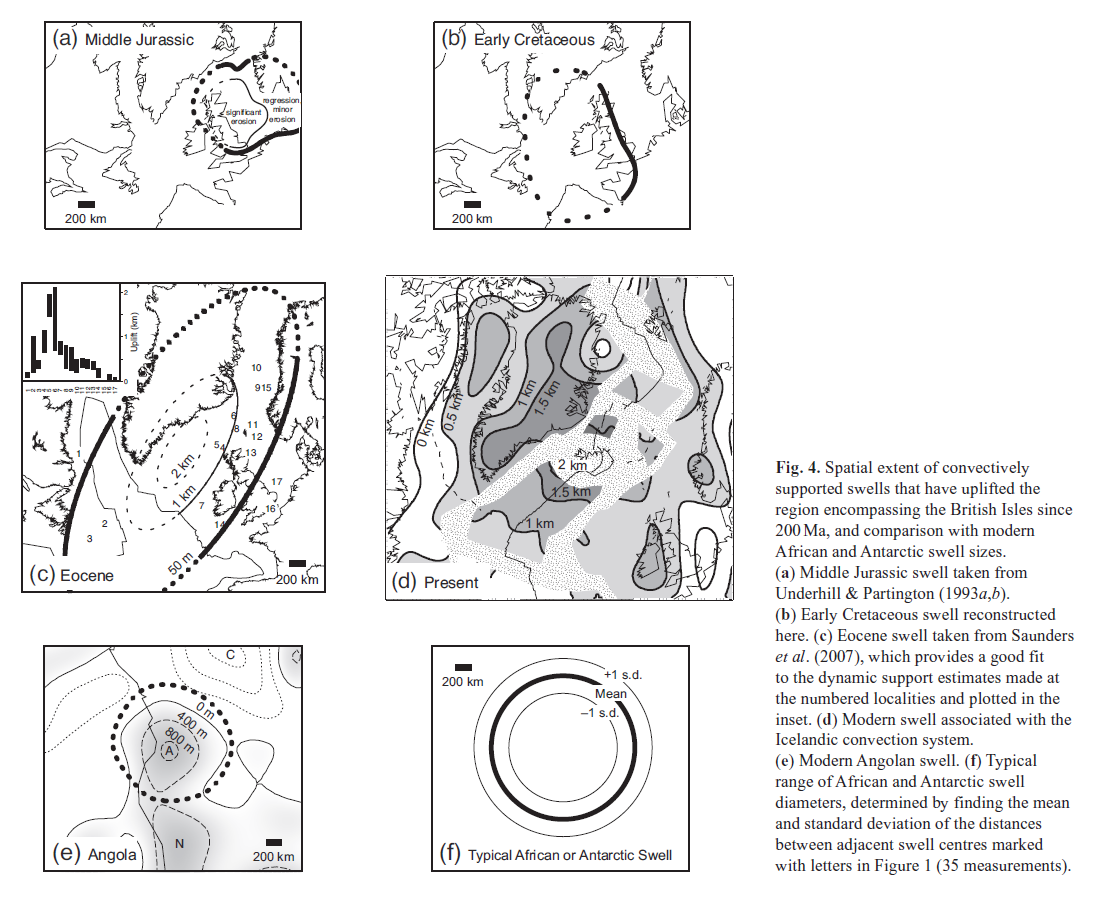
The UK, Ireland and associated oceanic basins make up a stable piece of crust with a long sedimentary record. There is a long and successful history of hydrocarbon exploration in the area, so there is lots of data to draw on. Our authors describe four swells from this area in the last 200Ma, active in the Jurassic, early Cretaceous, Eocene and present day (based on Iceland).
The evidence presented suggests that these ancient swells are similar in dimensions to present day African ones and formed over similar timescales, growing in 5-10Ma and decaying over 20-30Ma.
A fail for Vail?
The effect of these swells on sedimentary sequences is dramatic – a kilometre of uplift turns a sedimentary basin into an area of erosion. Dynamic support is not just of interest to students of the mantle, but also to lovers of sedimentary basins or those who seek the oil and gas found therein.
It’s been long understood that patterns of sedimentation are controlled by tectonic factors (creating holes with extensional or foreland basins) and by sea-level changes. In the 1970s, the work of a group at Exxon led by Peter Vail transformed the study of sedimentary basins. Their new techniques of sequence stratigraphy showed that patterns of sedimentation are best explained by different cycles of changing water depth (relative sea-level). The level of water within a typical sedimentary basin is constantly changing on both high and low frequencies.
Note that this relative sea-level change can be caused either by moving the surface of the earth or moving the surface of the water. Vail ‘chose’ to move the surface of the water and sought to explain local patterns in terms of global “eustatic” sea-level change. During periods of glaciation there is a plausible mechanism for doing this and the model is successful (for example, the Carboniferous of the UK). A longstanding problem is how to create cycles of sea-level if there are no ice-caps to vary in size and periodically change the volume of sea-water.
In his 2010 Presidential Address for the Geological Society of London, Bryan Lovell challenges the Vail hypothesis asserting that “mantle convection provides an alternative, regional, mechanism to eustatic control for explaining medium-frequency to high-frequency sea-level cycles“. Relative sea-level changes can be explained by moving the surface of the earth in a particular area. Over a mantle swell, basins will be shallower or stop being basins even if global sea-level remains constant.
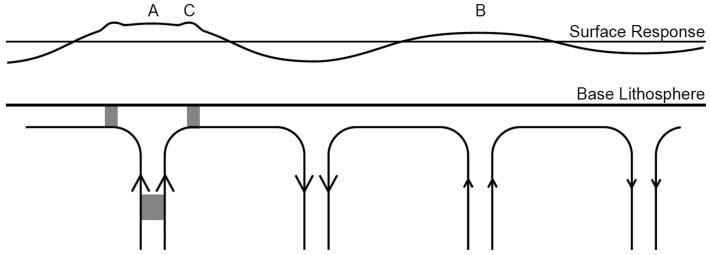
Lovell proposes a mechanism to explain the different frequencies of cycles. Mantle swells, created by convection cells, work over the 10-40 Ma timescale. He proposes that ‘hot blobs’ (grey patches above) move within the wider cells. The blobs cause their own smaller scale (and faster moving) ‘mini-swells’ that explain the higher frequency patterns seen in sediments.
What I like best about the idea of dynamic mantle support of topography is that it is testable. By starting to quantify the time and length scales of mantle swells it becomes possible to recognise them reliably in the stratigraphic record. Changes due to global sea-level variation will be correlatable across many basins whereas mantle swells will not.
Its another way of thinking about the earth, too. As someone living on a tectonically quiescent patch of the earth I’m used to thinking of nothing much happening here until the Atlantic starts to close again. It turns out that “there is no such thing as a stable continental platform” and that a change in the way rocks are flowing deep below could move Britain up or down by a kilometre within as little as 10 million years.
References
Picture of Drakensburgs via Palojono on Flickr under Creative Commons.
Jones, S., Lovell, B., & Crosby, A. (2012). Comparison of modern and geological observations of dynamic support from mantle convection Journal of the Geological Society, 169 (6), 745-758 DOI: 10.1144/jgs2011-118
Lovell, B. (2010). A pulse in the planet: regional control of high-frequency changes in relative sea level by mantle convection Journal of the Geological Society, 167 (4), 637-648 DOI: 10.1144/0016-76492009-127


wow, so Lovell (2010) says that vertical changes with amplitudes of 10s of meters can occur in less than a million years … I need to read that paper to see the evidence
I was originally skeptical, but am starting to come around. The concept is nicely explained by Lovell (2010) and related papers (esp. Shaw Champion et al., 2008; Rudge et al., 2008). Intriguing idea that mobile blobs of hot upper mantle can migrate outward from a central conduit, pushing the Earth’s surface up and down at time scales and rates compatible with the Exxon group’s 3rd-order cycles. Who knew!
I came on your discussion while searching for a map of mantle-core bathymetry. A lot of years ago I learned from a geophysicist that data at that time showed som hundreds meters hills on outer core surface, and this keeps me intrigued still. Do you know about this? Thank you.