Long term megathrust earthquake aftershock patterns

Graph of aftershock rate against time relative to background levels for 300 years after a large megathrust earthquake. Schematic in top right shows relative distribution of core (blue) and corona (red) zones, which are plotted separately. In the core, the blue line shows a period of activity below background starting within a few years and persisting for several centuries; in the corona the red line shows a decline to background within a few decades.

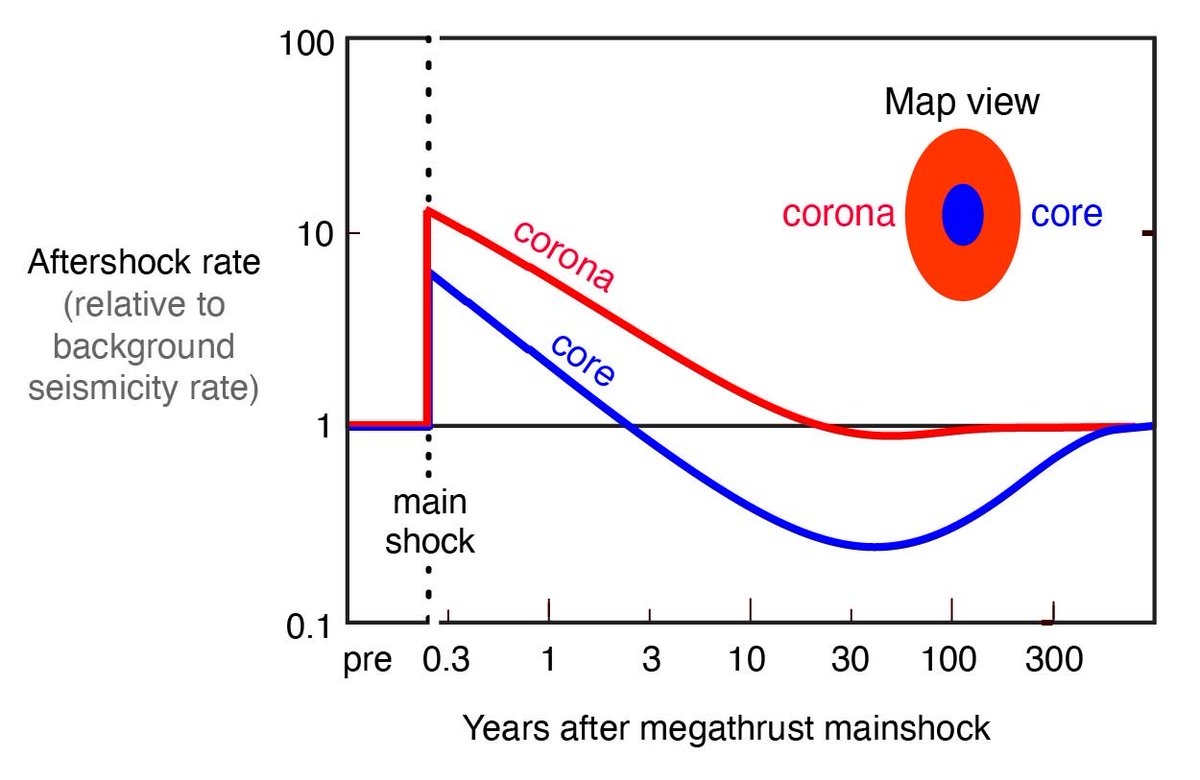
Model of aftershock rate against time relative to background levels for 300 years after a large megathrust earthquake. Schematic in top right shows relative distribution of core (blue) and corona (red) zones, which are plotted separately. From Stein & Toda (2022).

Leave a comment:

Your email address will not be published. Required fields are marked *

This site uses Akismet to reduce spam. Learn how your comment data is processed.