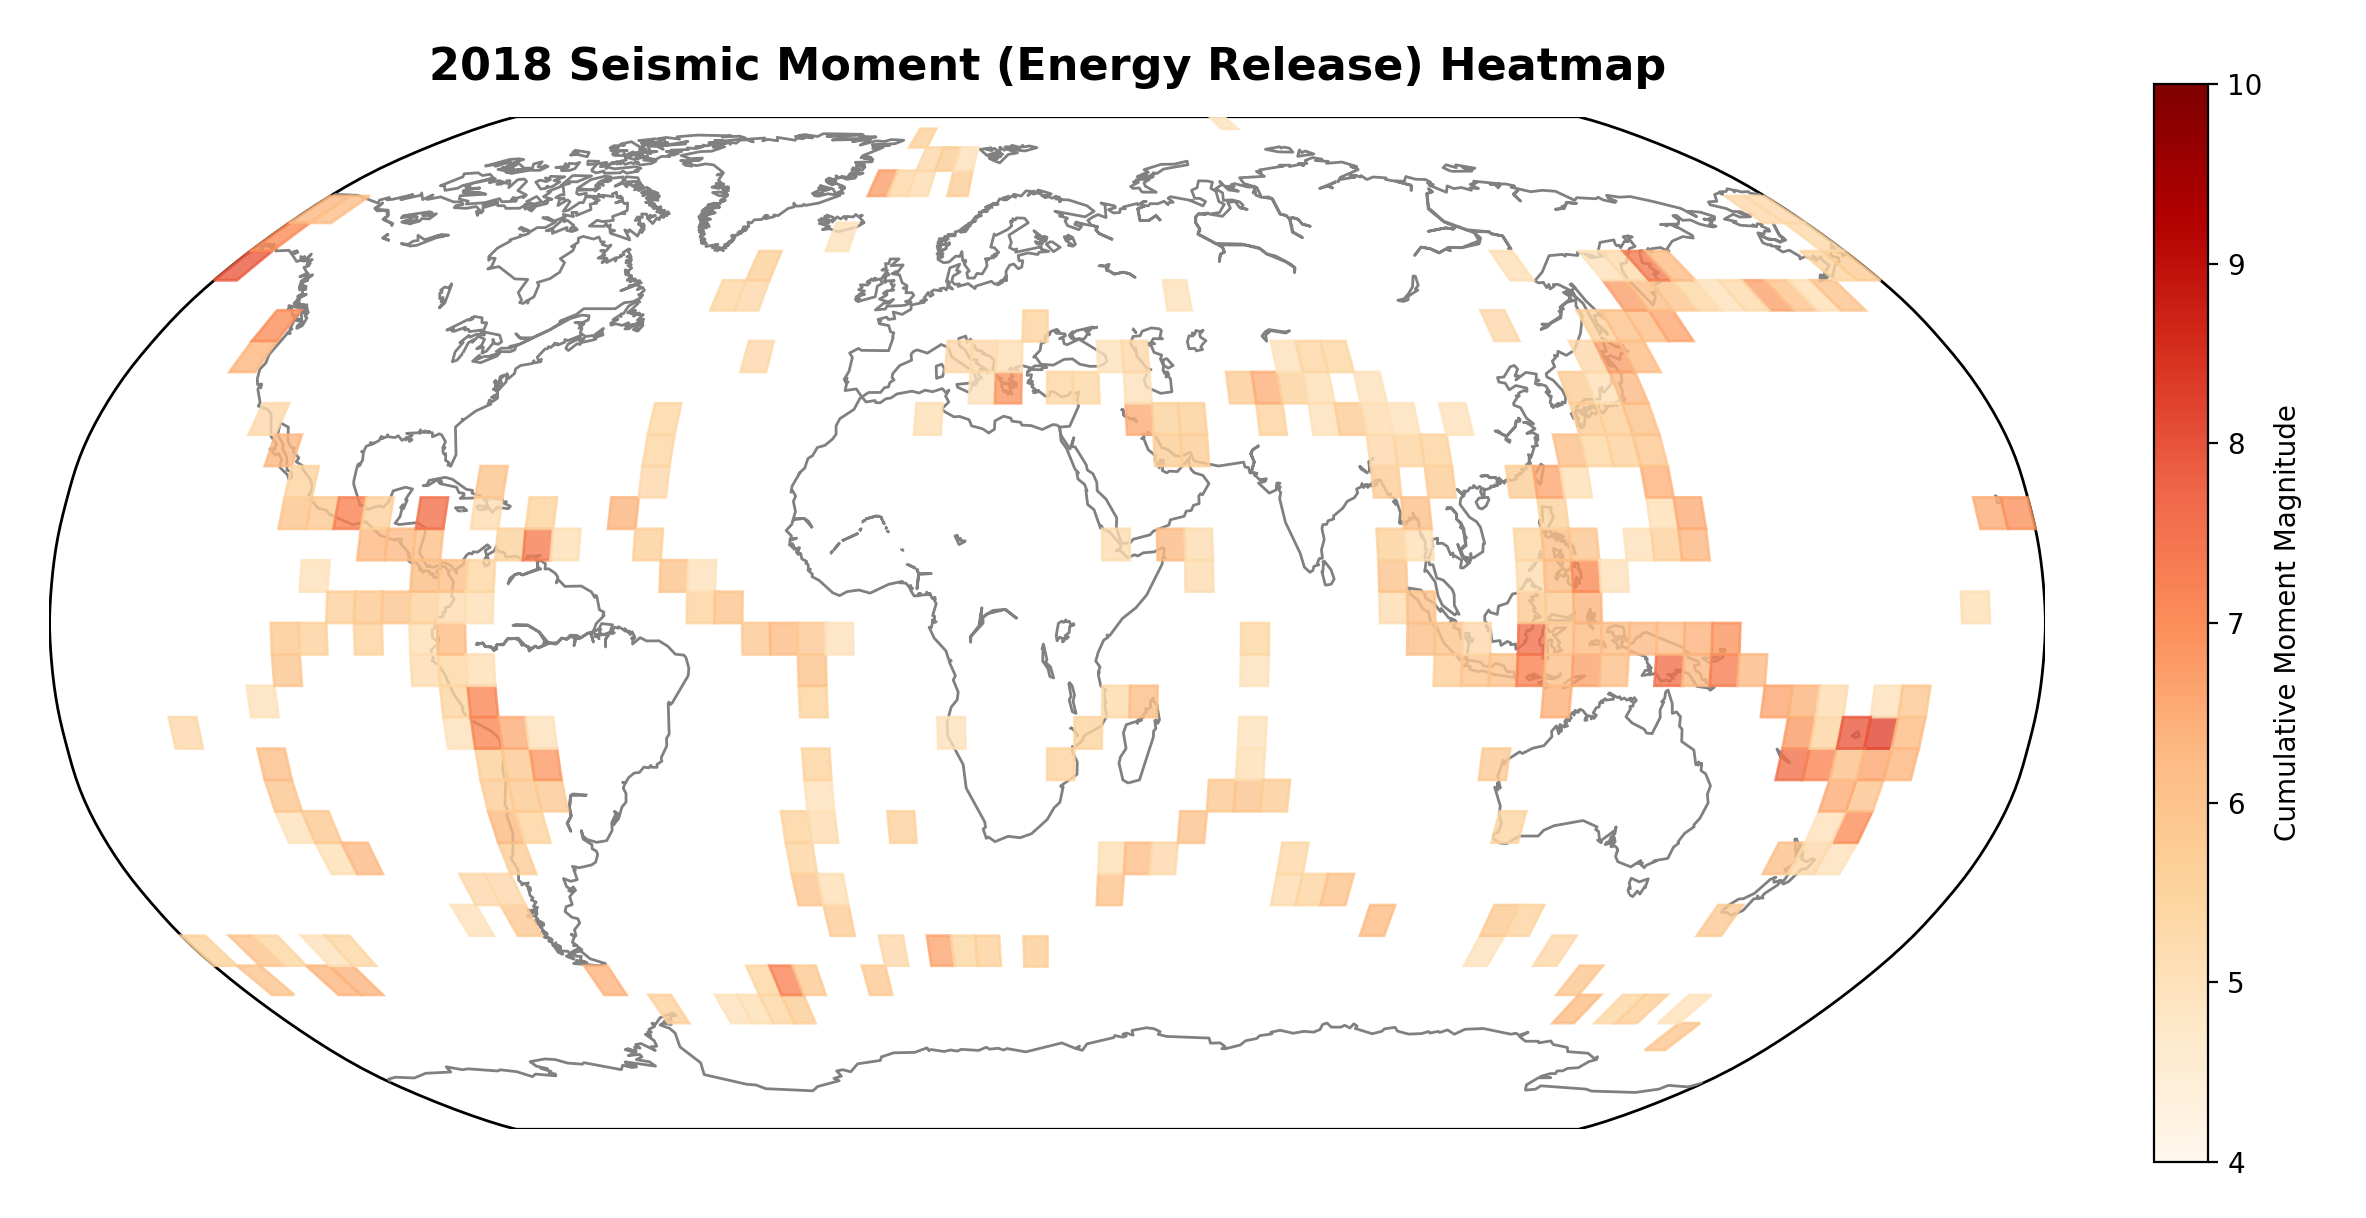
Heat Map of global seismic activity in 2018, scaled to total moment release from all M5+ earthquakes in each 5º grid square
Global map with coloured squares; stronger reds are places where more energy has been released in earthquakes.

Heat Map of global seismic activity in 2018, scaled to total moment release from all M5+ earthquakes in each 5º grid square
Global map with coloured squares; stronger reds are places where more energy has been released in earthquakes.