It has never been so easy to overlay your data on a background of satellite images. This post explains how to do it using QGIS, which is free/open-source software. This gives it the huge advantage that you can download it and install it on as many computers as you want. It is very easy to use, and once you have your data into a Geographic Information System, you can then perform other analysis.
1 – In the field
This part is obvious: make a note of the location where you take a measurement/sample! The easiest way is to use GPS and to make a new waypoint for each location. Write the coordinates in the notebook, too, as a backup.
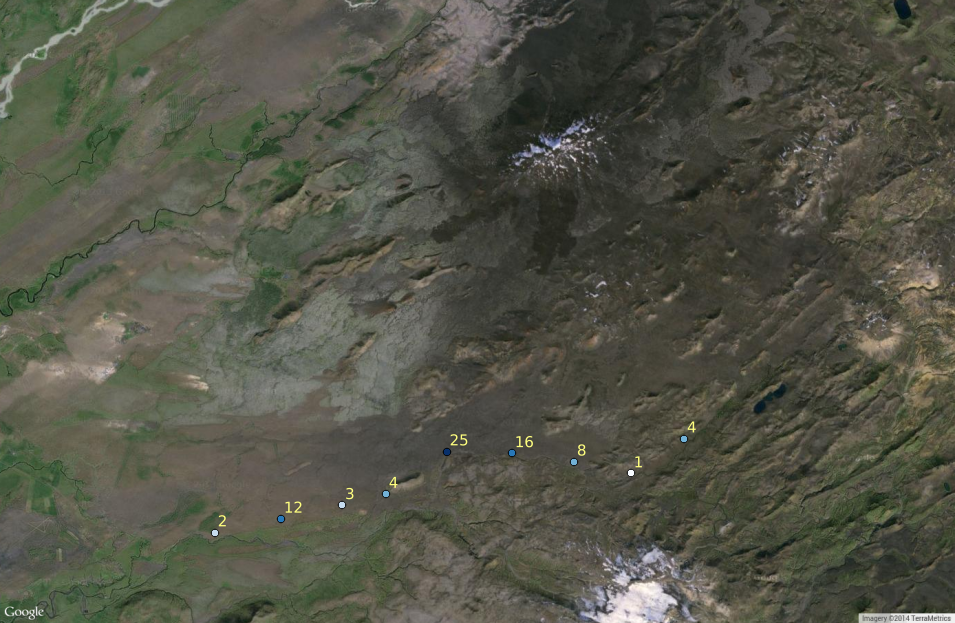
In this case, the data are the thickness of tephra (pumice, ash and other volcanic debris) deposited by the 1947 eruption of Hekla. The local wind was blowing towards the south, before swinging around to deposit volcanic ash across the UK and Ireland then over to Finland.
2 – Preparing a CSV file
We are going to load the data into QGIS from a plain-text comma-separated values (csv) file. Most GPS software should be able to export waypoints in this format. The free/open source GPSBabel software can download data directly from a GPS or convert between different formats. It has a graphical user interface and command line version. An example command to extract the waypoints from a .gpx into a .csv file is below:
gpsbabel -w -i gpx -f gps_data.gpx -o csv -F measurements.csv
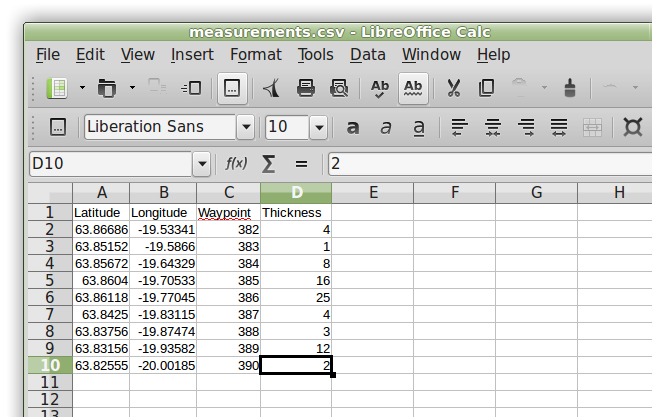
Open the .csv file in a spreadsheet or text editor and make the following changes:
- Add a row of column names at the top. Include as many extra columns as you need for your data (e.g. Latitude, Longitude, Waypoint, Thickness, Grainsize, SampleNo).
- Add your measurements to the data columns.
 Then save and close the file. If you don’t have a GPS, you can make a blank spreadsheet and type in your own coordinates by hand.
3 – Loading into QGIS
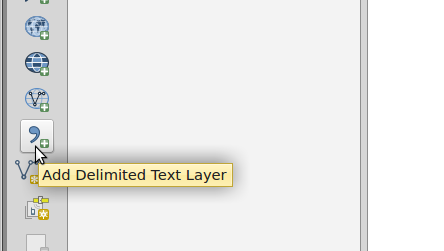
- Open QGIS and click on ‘Add Delimited Text Layer’, then select your file.
- If it doesn’t do it automatically, set the X and Y fields for your data.
- Press OK and your data should appear as a new layer.
- Double check that the Coordinate Reference System is correct by right-clicking your data and selecting Set Layer CRS.
- For raw GPS data, use WGS 84 (represented by Authority ID EPSG:4326)
- UK Ordnance Survey coordinates are EPSG:27700

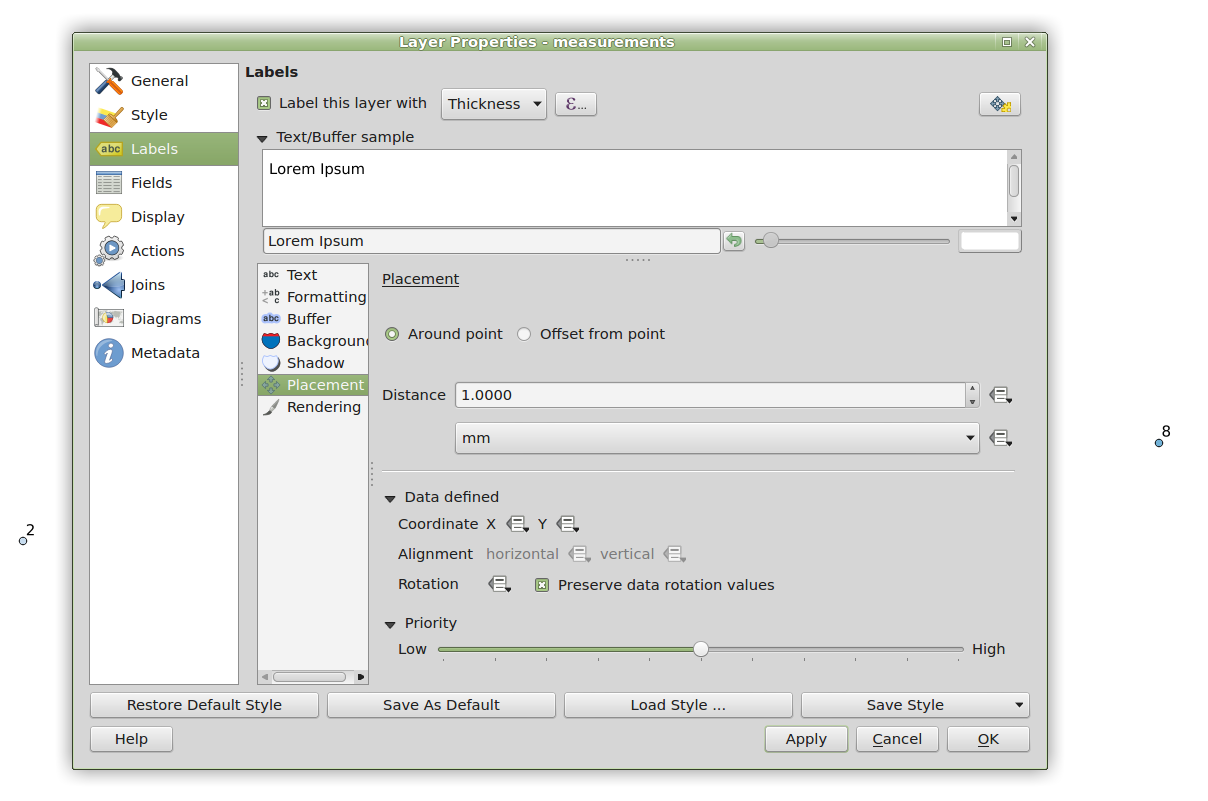
- Next, make your data prettier, using the Properties dialog (right click). We are going to change the symbols depending on the Thickness value and print the data alongside it. Features like this make using QGIS is much better than using Google Earth.
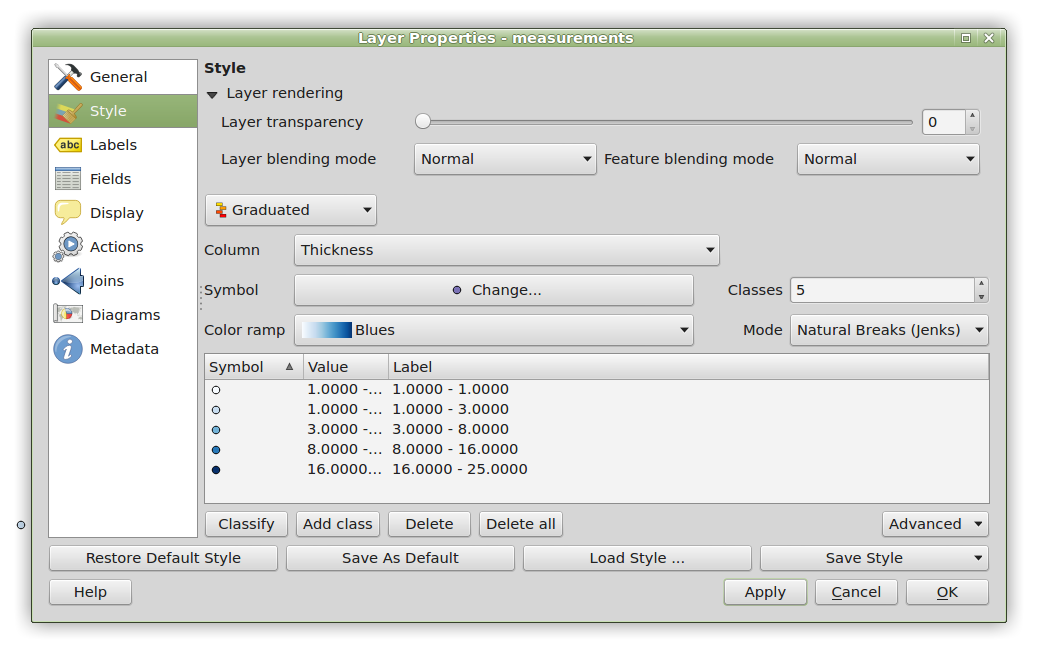
- Choose a Style for your data. I have used graduated colours based on Natural Breaks in my Thickness data.
- Use Labels to print the data values beside the points. I have selected the Thickness column and placed the text 1 mm away from the data. You could also use the Waypoint number or other data such as Sample Number.
4 – Plot the background map
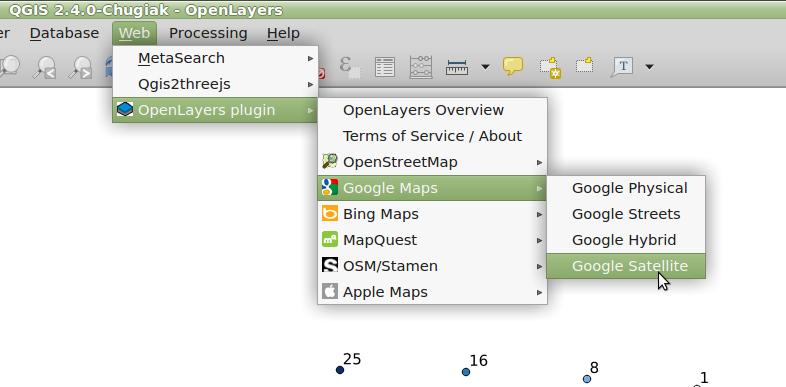
- Use the OpenLayers plugin (from either the Web menu or the Plugins menu, depending on your version) to choose a background map.
- Drag it to beneath your data layer in the Layers panel, then pan and zoom to get the map that you want.
- Voila! Pretty easy, eh? You can save a copy using Project > Save as Image…
5 – Other tips
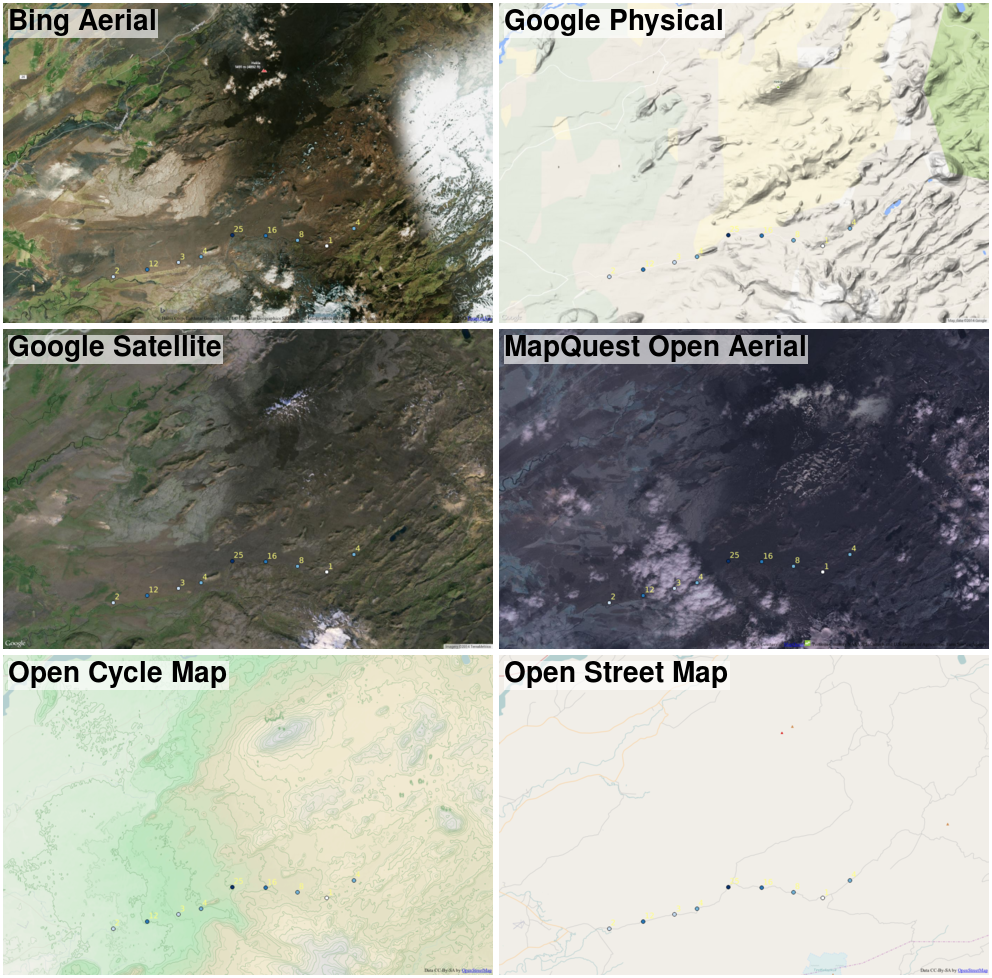
- Experiment with the other layers. Sometimes Bing Aerial layers are better than Google. Google and Bing may have copyright restrictions for professional use. Open Street Map is a really clean map background, Open Cycle Map has topographic features.
- Sometimes the OpenLayers map opens to show the whole world. In this case, right click on your data layer and select ‘Zoom to layer’.
- Sometimes the OpenLayers map doesn’t download all the tiles, leaving blank spaces. In this case, just pan the map a tiny bit and it should reload.
- The OpenLayers plugin only works online. To make a map available offline, turn off all layers except the OpenLayers background, then Save as Image…. Notice that as well as saving the image, a ‘World File’ (e.g. bg_googlesatellite.pngw) is created that contains georeferencing information for the map. As long as you keep the two files together, you can load the map back in directly as a raster map with Add Raster Layer…. You will need to set the Coordinate Reference System; by default this is EPSG:3857 for OpenLayers maps.
- If you select ‘watch this file’, then your maps will update with changes to the data.
- Use the QGIS Map Composer to make a more formal map with title, scale bar etc.
Further reading
QGIS and GPSBabel can be installed on Ubuntu-like Linux systems with a single command:
sudo apt-get install qgis gpsbabel- Installation of OpenLayers plugin
- There is a checklist for collecting georeferenced field data in my Fieldwork guide for robots (and humans)
- If your fieldwork is in Iceland during summer, or the UK during the rest of the year, my Volcano suit / What to wear in Iceland may be useful.
- The Quick, multipart, annotated figures with ImageMagick post explains how to make combination figures like the last one.

