Snow, water, digital imaging, metamorphism…and a guillotine!
Cross-posted at Highly Allochthonous
When water infiltrates past the ground surface and begins to percolate through the soil’s unsaturated zone, it doesn’t move downward like an even sheet. Instead, fast fingers of water move downward along pores, roots and other places where flow is easier than through the soil matrix, and water lenses accumulate horizontally where there are changes to less permeable soil horizons. The same principles apply to snow, with the added bonus that the water flowing and the matrix is flowing through are made up of the same substance, separated only by a temperature threshold. So you can get some really complicated dissolution/melting and precipitation/freezing reactions going on throughout the snow profile.
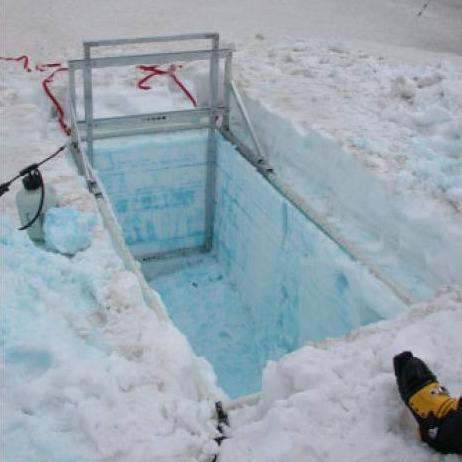
A good way to see these patterns is to apply dyed water to the land or snow surface and then dig a soil or snow pit to examine where the dye ends up. Now Williams et al. (2010) have devised a really cool device for taking sequential, thin, uniform slices of snow off the wall of a snow pit, so that they can see and measure the 3-D structure of preferential flow within the snow profile. They call their device a snow guillotine, because it is basically a sharp blade mounted on a frame that sits on top of the snow surface. A camera is also attached to the frame, at fixed distance from the blade. The blade and camera are mounted on a slider, so after taking a slice and an image of the snow and dye, the scientists can slide it a specified distance and take another slice exposing a new snow surface. (Of course, being good field scientists, all of this can be packed into a remote site, as shown below.)

Image from Williams et al (2010) showing the snow guillotine in operation in a dyed snowpack in Colorado. Ski boot for scale.
After the scientists have taken all the slices and photos they want, they can go back to their warm, cozy offices and apply digital image processing techniques to the photos to quantify the 3-D patterns of preferential flow. The vertical images are rectified and can be stacked together into data cubes, allowing the researchers to examine the horizontal centimeter-meter scale patterns as well. You can see this in animated movie of one of their snowpacks in the supplemental materials (no paywall!).
This paper details the results of two dye experiments conducted in Colorado in May and June 2003. Both experiments occurred in isothermal (0 C) snowpacks, but in the second experiment the snow had been isothermal for a longer period of time and had ablated (melted + sublimated) more extensively than in the first dye application. The first experiment showed significant vertical and horizontal heterogeneity, particularly in the upper 20-55 cm of the snowpack, where there were up to 300 distinct vertical preferential flowpaths per square meter. At interfaces between snow layers (i.e., snow that fell at different times) there was significant lateral flow, probably as a result of permeability changes at those boundaries. In lower parts of the snowpack, downward flow was somewhat more evenly distributed and the preferential flowpaths tended to be larger. In the second experiment, more snow metamorphism had occurred, resulting in larger grain sizes and open spaces. In this snowpack, there was still some preferential flow, but, in general, flow was much more evenly distributed throughout the matrix. This finding brings into focus how the snow’s thermal history controls meltwater pathways.
All together then, the dye experiments, cut and photographed by the guillotine setup, and digitally processed in the lab emphasize the importance the small scale (cm to m) heterogeneity on flow through porous media. This isn’t super surprising to people who have spent time studying water flow through soils, but when you are dealing with snow, you add thermodynamics and a matrix that can dramatically metamorphose over time scales of hours to days to weeks to the mix. That adds a level of complexity that makes my mind boggle a little bit, yet Williams et al. have found a simple method to collect to field measurements and process the images in a way that lets them quantitatively describe these flowpaths and will hopefully contribute to a better understanding of the processes and interactions between snowpacks and snowmelt.
Williams, M., Erickson, T., & Petrzelka, J. (2010). Visualizing meltwater flow through snow at the centimetre-to-metre scale using a snow guillotine Hydrological Processes, 24` (15), 2098-2110 DOI: 10.1002/hyp.7630
