Measuring precipitation: radar and satellite based measurements
In the previous post, I reviewed approaches for point measurements of precipitation (i.e., rain gauges), talked about the care that must be taken to site well and minimize undercatch, and identified some of the common data sources for rain gauge measurements in the United States. Rain gauges do a great job of telling us how much precipitation is reaching the ground surface at the place where they are located, but the vexing problem is figuring out how well that point measurement represents a broader area of interest. So in this post, I want to focus on technologies that look to the sky to provide data on the intensity of precipitation occurring over broader areas.
Radar Rainfall Measurement
How does it work?
Radar systems have antennae that send out pulses of electromagnetic energy that are reflected off a targets and returned to the antenna. The energy return is used to calculate reflectivity (Z). Here’s a nice short (2-3 minute) explanatory video from the UK Met Office.
So the radar systems are measuring reflectivity from the rain, but how is that converted to rain rate? The reflectivity (Z) depends on the number of rain drops and their diameter. An increase in drop diameter increases reflectivity to the sixth power. So if rain drop diameter doubles, reflectivity increases by 2^6 = 64. This is important for calculating rate (R), because rate depends on drop diameter, the number of drops, and the drop fall speed. And bigger drops generate faster rainfall rates. An increase drop diameter increases rate to the 3rd power So if diameter doubles, the rate increases by 2^3 or factor of 8. The relationship between Z and R varies depending on atmospheric conditions, so there isn’t just one equation to apply. Z-R relationships are better understood for rain than snow (this is related to the snow depth versus snow water equivalent (SWE problem). Both hail and wet snow have high reflectivity relative to the Z-R relationship for rain. Z-R relationships are checked against and corrected using point rain gauge measurements. This increases their accuracy relative to a radar-only approach.
Once you’ve got an appropriate Z-R relationship, then rainfall amount is simply the rain rate times the duration. Since radar scans occur every few minutes, radar rainfall measurements can not only give total precipitation from a storm but also provide data on how intensity varies within it.
Where does the data come from (in the US)?
There is a network of 158 Doppler radar systems that cover most of the continental US, and this system is called NEXRAD. Doppler radar provides additional information on the motion of air using the Doppler effect in addition to the echosounding of traditional radar. These Doppler radar systems have a range of 230 km (125 mi) radius from where they are installed, so the network is designed to cover most populated areas. Data quality are best closer to the radar sites than at the fringes of the range, and mountainous topography can create data gaps. Within a few miles of the radar sites there can also be issues with data quality.
This slightly longer (8 minute) video explains how NEXRAD works and the many ways that the data are used.
NEXRAD was developed in the 1980s and deployed nationwide in the 1990s, so the instruments are aging and prone to breakage. The National Weather Service (NWS) is undertaking upgrades and planned maintenance to extend the life of the installations to at least 2030.
NEXRAD data are used for flash flood warnings and they are often incorporated into river flow forecast models. Beyond NEXRAD there are also smaller and even mobile radar installations that are used for more localized applications, including research and new technology development. Unless you are involved in a project using these installations, data may not exist, be available, or be appropriate processed for Z-R, for your area and the time you need it, so the the NEXRAD precipitation data are the go-to radar data for most hydrologic applications.
Where do I get access to the data?

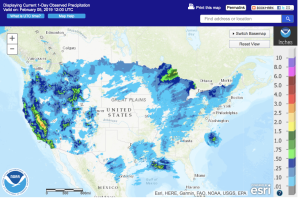
Screenshot of https://water.weather.gov/precip/ on February 6th, 2019, showing one day observed precipitation.
You can view one-day observed precipitation for the United States at https://water.weather.gov/precip/. That site allows you to zoom in to a particular area and select different dates from the archives. If you don’t want daily precipitation, you can add it up over longer periods. In addition to viewing data, you can download the data in several formats. Be aware that this is spatial data, so it’s not just a time series of measurements for one spot.
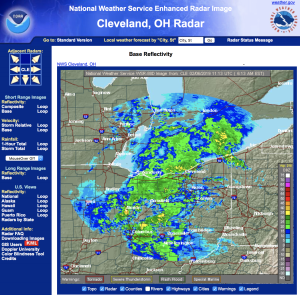
If you want to look at the NEXRAD data for the Cleveland site (which covers Kent), you can go to: https://radar.weather.gov/radar.php?rid=cle&product=N0R&overlay=11101111&loop=no. The default display is base reflectivity (Z), but if you look along the left column, you’ll see options for one hour and storm total precipitation. In the upper left corner, you’ll see arrows that let you move to adjacent NEXRAD sites and at the bottom you can click to view a larger region of the country.
In the US, daily radar precipitation measurements are publicly released for 4 km by 4 km grid cells (as shown at https://water.weather.gov/precip/), and researchers can access higher spatial and temporal resolution data from the National Centers for Environmental Information (also called the NCDC), including 1-hour precipitation, 3 hour precipitation, and storm total precipitation. Different spatial resolutions are available depending on whether the radar system scans the sky with a horizontal beam only or if it has dual polarization, which means that it scans with both horizontal and vertical beams.
Satellite Precipitation Measurements
This NASA video gives a great overview of the Global Precipitation Measurement Mission, which is an international mission to provide precipitation data for the Earth from 60 degrees N to 60 degrees S.
- GPM Microwave Imager (GMI) (amount, size, intensity and type of precipitation)
- Dual-frequency Precipitation Radar (DPR) (3D profiles and intensities of liquid and solid precipitation)
The satellite orbits 407 km (253 miles) above the Earth, with an orbital duration of 93 minutes. That means that it makes about 16 orbits per day. Thus, the data isn’t as a frequent as with ground-based radar, and its generally released . NASA offers the data at multiple levels of processing, but the highest quality rainfall data product is released at 0.1 degree (lat/long) spatial resolution. For our latitude, that’s a grid cell of about 11 km by 11 km, so it’s also coarser resolution than ground-based radar. What’s the advantage of satellite precipitation? Near global coverage. That means the data are available over the oceans and other places where ground-based measurements are sparse. For watershed hydrologists working in the United States, NEXRAD and rain gauges are more commonly used data sources, but if you are interested in working in other parts of the world or on really large scale hydro-meteorological phenomena, satellite products may be an invaluable resource.
Please note: The information above is designed for students in Kent State’s Watershed Hydrology class who are learning the basics of precipitation measurement. If you are an expert at anything in this post and discover an error, you can let me know with constructive pointers to better information.)


