This week is the first anniversary of the volcan01010 blog. With this post, I want to pick out some highlights from 2011, and to whet your appetites for some things to come in 2012.
Top 3 posts:
The main aim of the blog is to be a source of reliable and easily-understood information on Icelandic and other volcanism. I also want to showcase the use of open-source software in (geo)scientific research. Most posts are ‘feature-length’ to allow a deeper discussion of each topic, and I hope that this means that they are worth returning to months after they are first written.
The following 3 posts were among the most popular and give a good summary of what the blog is about:
- Grímsvötn eruption – frequently asked questions. This post, written at the onset of the May 2011 eruption, explained why the eruption was unlikely to cause as much disruption as Eyjafjallajökull 2010, even though it was bigger. The post got lots of hits because is was quoted by a number of news websites. It is worth re-reading, because the same will most-likely apply to the next Katla eruption.
- Grímsvötn 1 – Crossing the glacier. In August, I was lucky to join an expedition to the crater of Grímsvötn to study the newly-erupted material. It was an adventurous journey involving monster-trucks, crevasses and a crazy landscape of ice and tephra. This post describes the journey and explains what we found.
- All the software a geoscientist needs. For free! This post explains how you can replace packages such as Microsoft Office, ArcGIS, Matlab, Adobe Photoshop, CorelDraw with free and open source alternatives. Not just because it is cheaper, but because it makes your workflows portable and easy to automate.
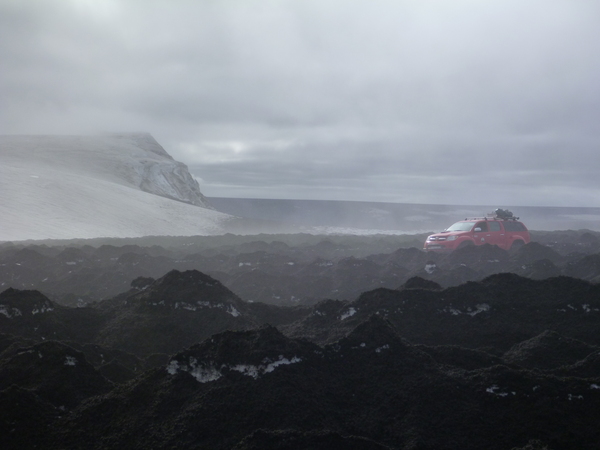
Crossing the tephra-covered glacier on the way to the crater of Grímsvötn. Click the image to read more.
Volcanoes, software tricks and general musings
There were a number of other Grímsvötn posts, explaining how to collect samples of falling ash in the UK and why it is so difficult to map the ash plume from a volcano. There were also posts about the deposits of the huge Hekla 4 eruption and the massive floods from Katla that make her eruptions so serious for Iceland. Outside of Iceland, there were videos of lahars at Volcán de Colima and an animation of the globe-spanning plume from Puyehue Cordon-Caulle.
Need to chop/rotate/annotate/join some images in a hurry? There was a post on ImageMagick to show you how. There were also general musings on the striking similarity between piles of grain and the shape of mountains and wondering why people insist on using Imperial units to measure babies.
The site now has an archive page, Every post ever, which you can browse other posts that might grab your interest.
Coming in 2012
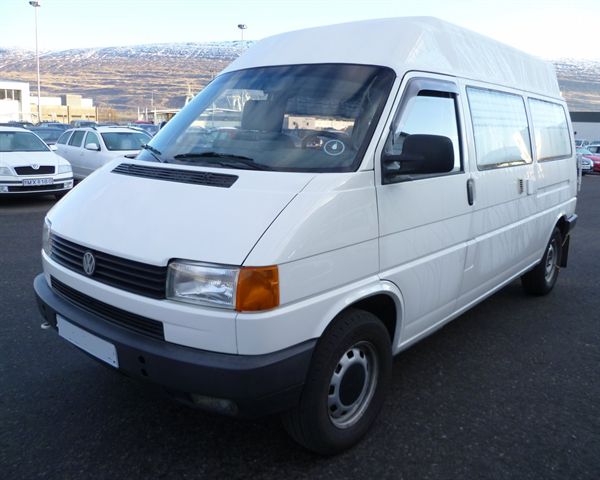
My home for the summer in Iceland: a VW Transporter T4 Syncro van.
From the end of March, I am off to live in a camper van in Iceland until the late autumn. I will driving round the country digging holes and sampling prehistoric tephra (pumice + ash) layers. I will be working with the Icelandic scientists responsible for monitoring their volcanoes, so if there is an eruption from Katla (who is still rumbling) or Hekla or anywhere else then I will be able explain things with the best information, direct from the scientists themselves.
On the computing side, it is a longer-term aim to post an introduction or quick-start guide to each of the programs described in the All The Software post. The Image Magick post is an example of this. Many of these will form part of a series called Quit wasting your life with Excel. Watch this space.
Subscribe, then tell all your friends
The best way to follow volcan01010 is to subscribe to the RSS feed. If you’ve never heard of RSS, read this guide. It lets you keep track of posts that you have read and tells you when a new one is out. You can also follow me on Twitter (@volcan01010). This way you get updates with other news and links that I think are cool, but if you follow lots of people then it can be easy to miss announcements of new posts.
Volcan01010 now has 201 followers on Twitter, and in the last year the blog scored 21,679 page views from 10,049 unique visitors in 149 countries (with the vast majority in the UK and USA). It has passed an important psychological barrier of at least 100 reads per new post, which means that the total time spent reading an article is now more than the time it takes to write!
If you find the blog interesting or useful, then please tell all your friends. Then tell them to tell all their friends, too. It’s going to be an interesting year.


All the best, neighbour!
I like your idea about the 100 reads-per-post, that makes a lot of sense.
Also good to see someone writing about open-source in the geological context. I work in IT and its easy to forget the impact open-source has made even in the corporate software world I work in. It’s something non-IT folks are often not so aware of.
Thanks, Simon.
I don’t think that I’ll be overtaking the Mail Online soon, but it’s good to be able to see things building slowly. About a 1/4 of the hits are from the Grímsvötn eruption post and its follow up.
It’s easy to get evangelical about open source software. Freedom from viruses, free-trials or dodgy cracked software is great. I also think that the Linux/Unix way of working, with scripts and small, modular programs, is really well-suited to the data-processing aspects of science. It’s more like a tool box that you are free to use how you want. There are lots of sites about open source stuff, but I want to focus on the jobs that people around me are doing. Sometimes, as they are struggling with ArcGIS, you think to yourself: ‘there is a much better way of doing that’. That’s mainly what I want to write about here.
John
Congratulations on the 1-year mark. We’re very happy to have you here. I would be all ears for ArcGIS alternatives, particularly for DEM processing and analysis. And keep the volcano goodness coming too.
Thanks Anne,
More GIS stuff is definitely in the pipeline. But it is a pretty long pipe!
As I rule of thumb, QGIS is really good for viewing and plotting GIS data, but for processing and analysis, GRASS is the answer. On Windows, you can install both from the same package, OSGeo4W. For Linux, see the ‘All the software’ blog post. For Mac, look at the OSGeo website for instructions. For a taste of all things hydrological that GRASS can do, have a look at this tutorial.
Hi John,
the van is nice…..looking forward to see it in action!
I will check out the software you are suggesting, better than spending all my money on software.