
Like many others as Twitter continues its apparent spiral towards death eternally gridlocked dysfunction, I have been testing the waters on the distributed social network Mastodon. So far, I’ve been quite enjoying it, but it has been a big system shock for the people already there, both in terms of the physical demands of handling so many more people, and in terms of having to deal with a large new population who are more habituated to the way things work on “the bird site” than the norms and practices that have emerged over many years on Mastodon.
One particular point of friction in this clash of cultures seems to be the use of “content warnings”. The ability to do this, which hides most of your posts under a description until the user clicks, is built right in, and there seems to be a general attitude amongst longer-term users that you should take advantage of this functionality whenever your content could potentially upset someone.
Essentially, you are giving people the choice about seeing something potentially upsetting that pops up in your feed, versus forcing them to see it. As some have pointed out, there is certainly potential for abusing content warnings, by insisting on them to stifle ideas or experiences you don’t want to engage with. But this is not the case when I am posting about the death toll and effects of deadly disasters. To be honest, I am rather disappointed in myself that it took moving a social network to have a discussion about when content warnings might be appropriate when talking about earthquakes, volcanoes and other disasters.
Proposed content warning policy for Mastodon
- When discussing any natural disaster, I will use a content warning when:
- Posting a picture or video showing significant damage or destruction, particularly where significant death or injury has likely resulted.
- Discussing death and/or widespread destruction due to a disaster.
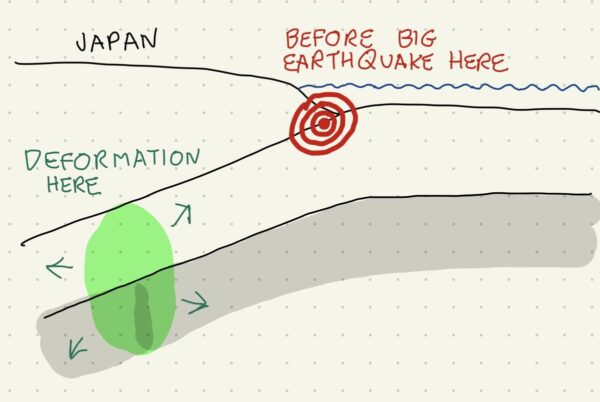
- When I am discussing the causes of a geological disaster, or other scientific information about it, whilst that disaster is ongoing, and in the immediate aftermath, I will also use a content warning. Hashtags will either be generic (#earthquake) or a modified version of the public hashtag for that event (#HoodEruptionScience). This is to prevent these discussions drowning out more urgent information about the disaster – emergency response information, for example.
- In both cases, the content warning will be as specific as possible, for example “Discussion of deadly earthquake in Indonesia in 2004”, or “Scientific discussion of ongoing volcanic eruption in…”.
With regard to item 2., it may be that Mastodon, because of its different organization, does not become a real-time news feed in the way that Twitter has become. But it is best to err on the side of caution, at least for now.
Content warning policy for Twitter(?)
Since I am still nominally active on Twitter, I have also considered what such a policy might look like there, where you can give pictures content warnings but not entire tweets. Making the first tweet in a thread a content warning might quasi-work, because sometimes only the first tweet in a thread is made visible in someones timeline, but in my experience it doesn’t always work that way. I will see what happens if the circumstances arise.


Nice plan for content warnings on Mastodon and the Fediverse. Now you need a Mastodon/Fediverse button on this blog.