Earthquake prediction is a fool’s errand

Predict_Quakes

Sketch plot of relationship between the timescale of an earthquake prediction and the likelihood of it being true - the curve is a step function, showing a high chance of being wrong for all periods of less than a few centuries

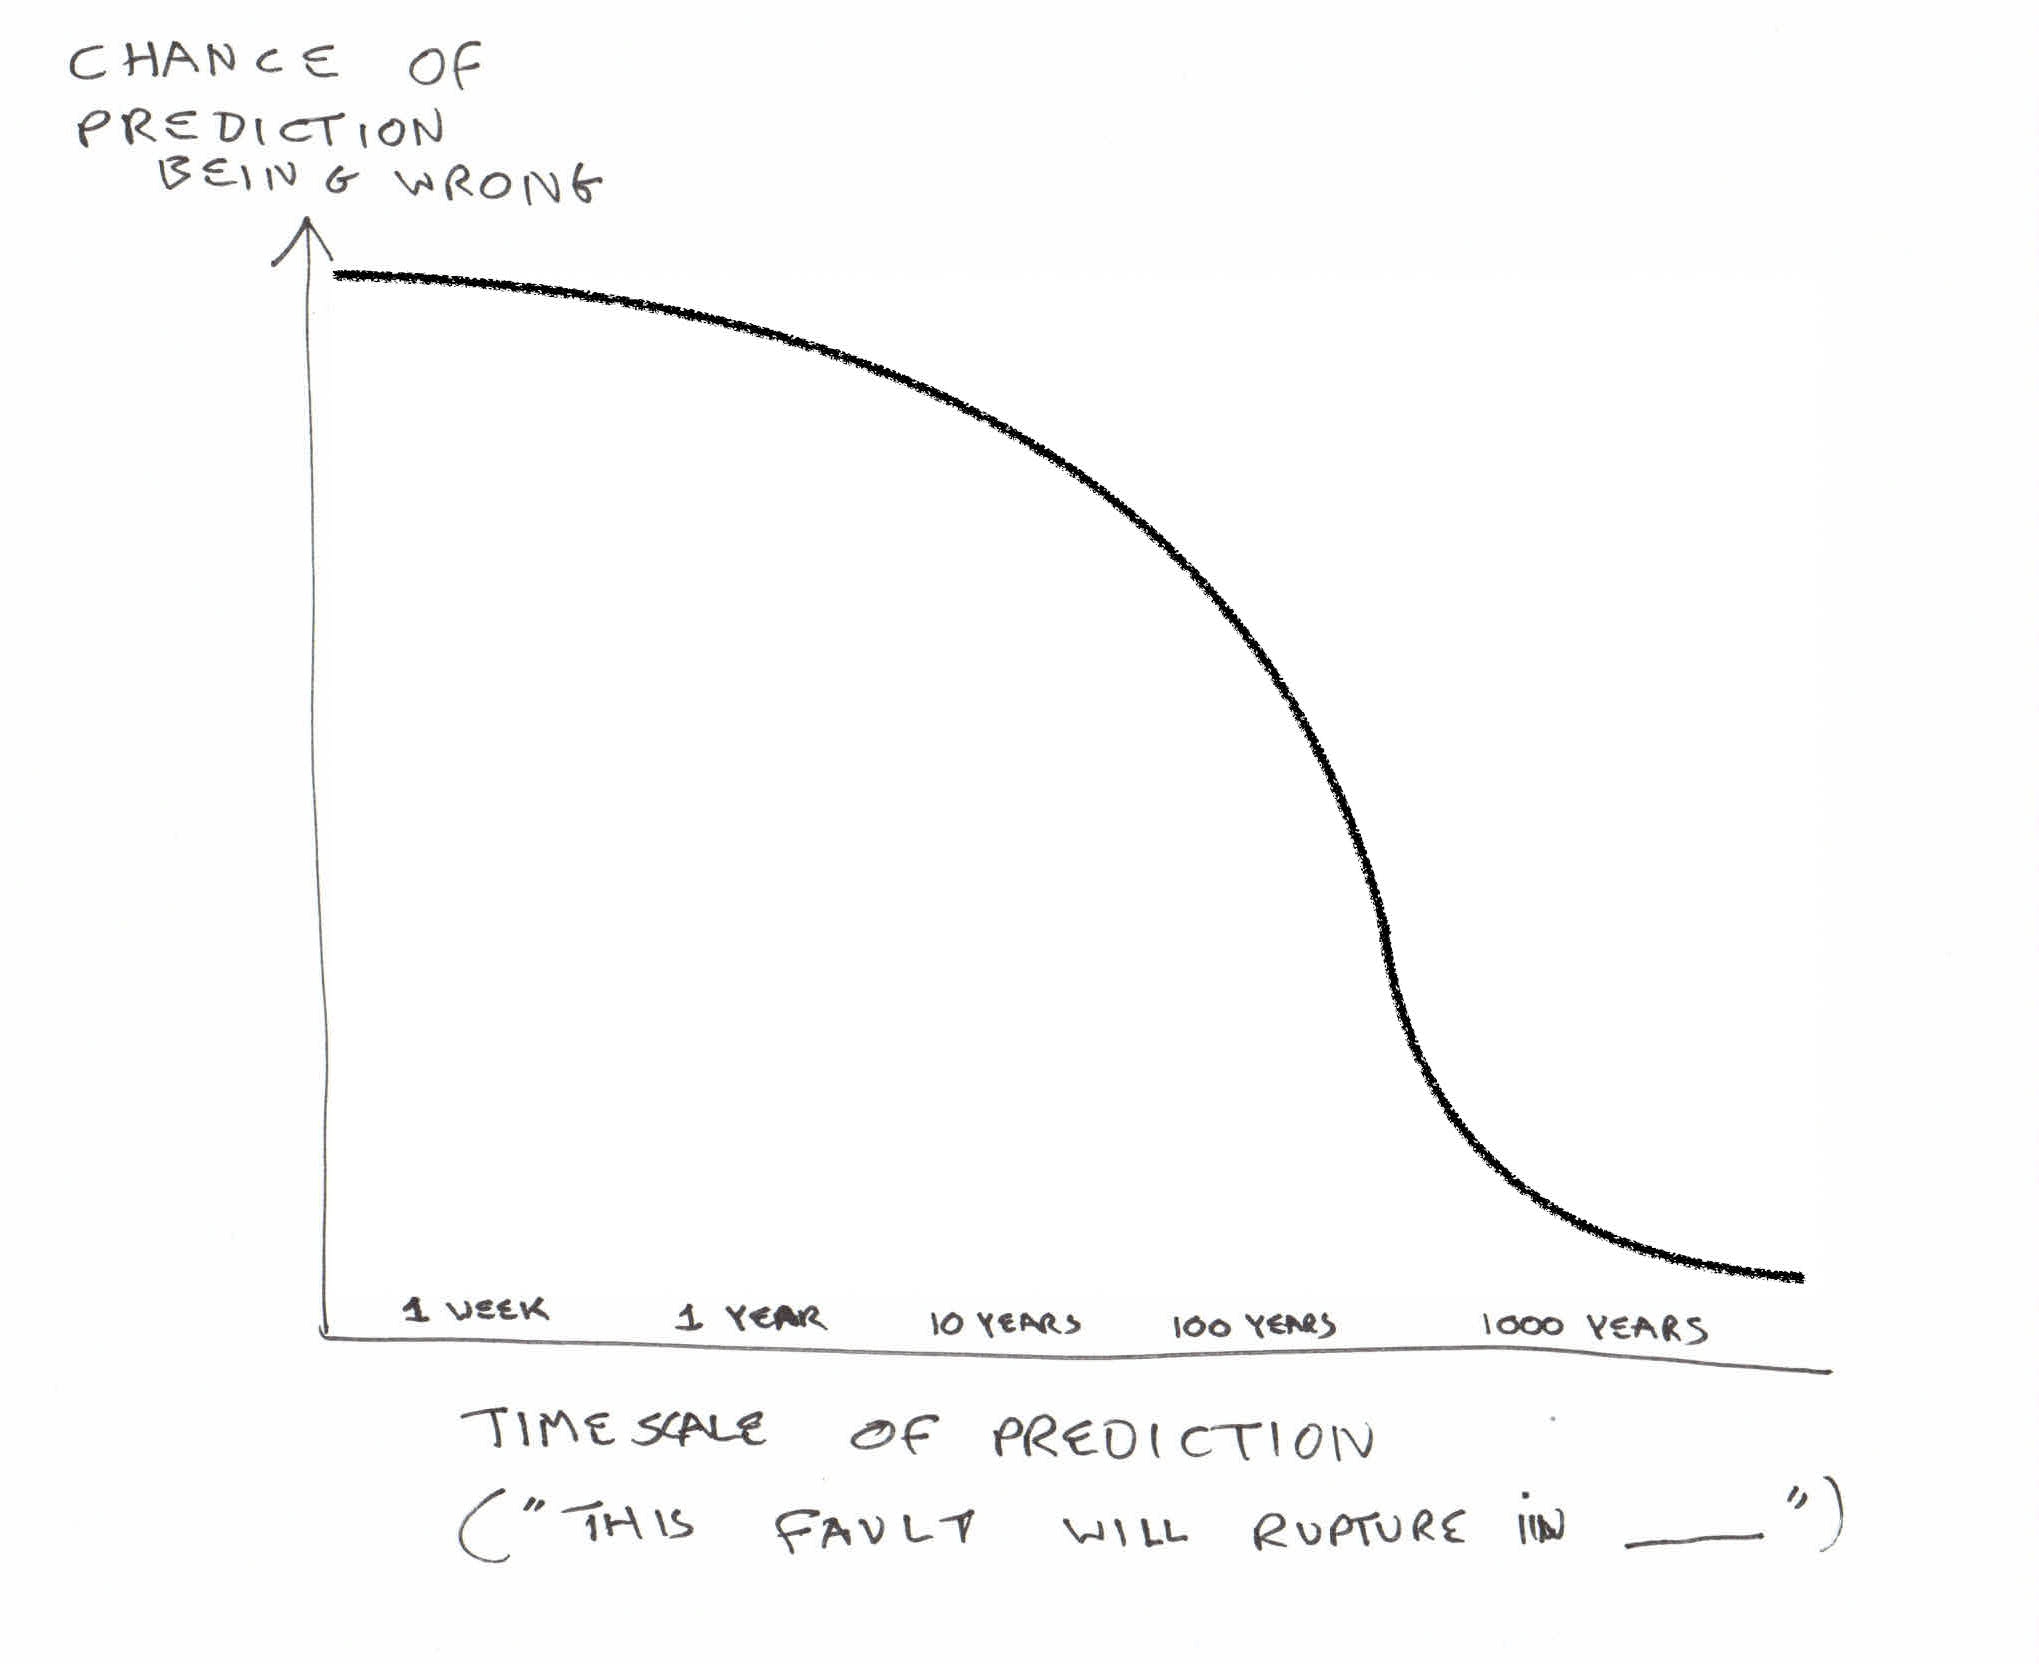
Our certainty about an earthquake occurring within a particular timeframe is only high over periods of centuries or more. For anything less, our prediction has a very high chance of being wrong.

Sketch plot of relationship between the timescale of an earthquake prediction and the likelihood of it being true – the curve is a step function, showing a high chance of being wrong for all periods of less than a few centuries

Leave a comment:

Your email address will not be published. Required fields are marked *

This site uses Akismet to reduce spam. Learn how your comment data is processed.