A Seismic Summary of 2017

2017QuakeSummary

Bar charts showing numbers of magnitude 5 to 6, 6 to 7, 7 to 8 and greater than 8 earthquake in 2017. The average, maximum and minimum frequencies since 1970, and the average for the past 6 years, are also shown.

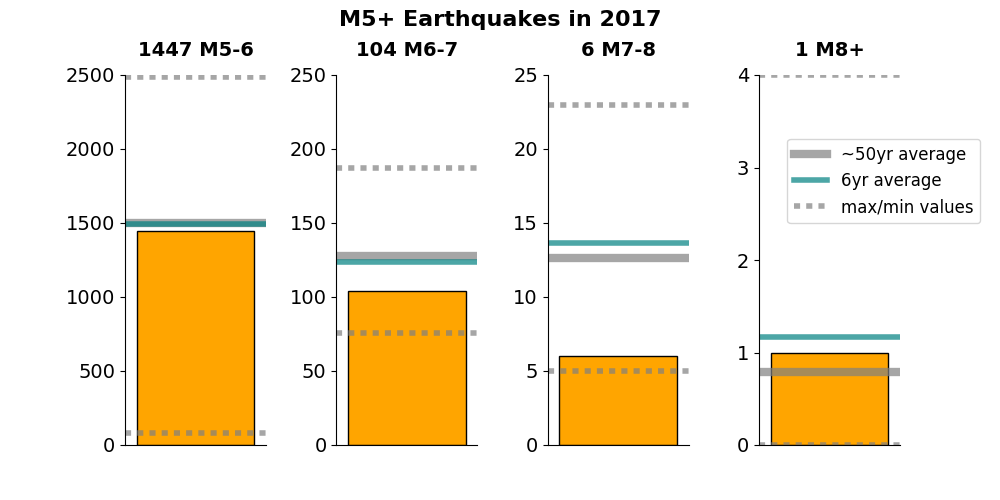
Number of earthquakes in different magnitude ranges in 2017, compared to longer term averages and ranges.

Bar charts showing numbers of magnitude 5 to 6, 6 to 7, 7 to 8 and greater than 8 earthquake in 2017. The average, maximum and minimum frequencies since 1970, and the average for the past 6 years, are also shown.

Leave a comment:

Your email address will not be published. Required fields are marked *

This site uses Akismet to reduce spam. Learn how your comment data is processed.