
![]() There’s much more to geological mapping than colouring in, but a big part of the process of reconstructing the geological history of an area is spending a lot of time examining the exposed rocks to work out how to distinguish the different units in the field, and then marking their distribution on your map using easily distinguishable colours, that enable you to more easily see the regional patterns that reveal sandstones and limestones; stratigraphy and structure; and faults and folds. It can be a lot of hard, meticulous work.
There’s much more to geological mapping than colouring in, but a big part of the process of reconstructing the geological history of an area is spending a lot of time examining the exposed rocks to work out how to distinguish the different units in the field, and then marking their distribution on your map using easily distinguishable colours, that enable you to more easily see the regional patterns that reveal sandstones and limestones; stratigraphy and structure; and faults and folds. It can be a lot of hard, meticulous work.
But then, there are places where the Earth just decides to do all that work for you.
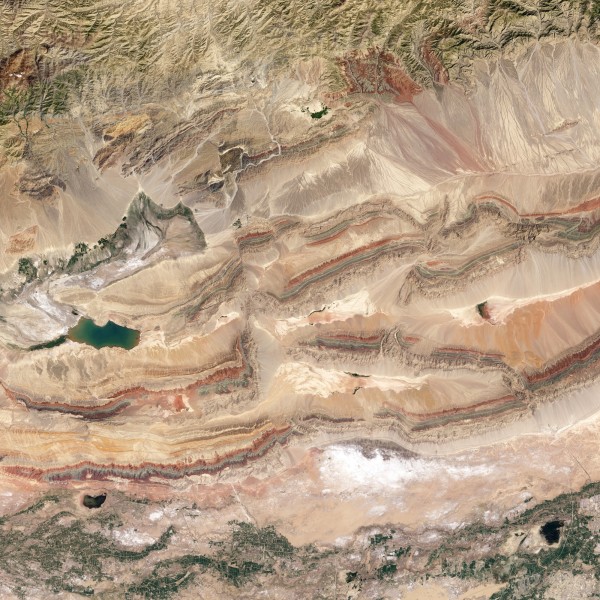
Satellite view of the foothills of the Tien Shan mountains, northern Tarim Basin, Xinjiang province. Click to enlarge. Source: NASA Earth Observatory
This amazing Landsat 8 image was an Image of the Day at the NASA Earth Observatory last week, and it’s pretty much a geological map all on its own. A convenient combination of active tectonics that leads to erosion and exposure of fresh surfaces (the Tien Shan mountains on the northern edge of this image are a distant product of the ongoing collision of India and Eurasia), virtually no obscuring vegetation due to the arid climate, and some extremely distinctive rock units formed in very different environmental conditions 400 to 500 million years ago, allow us to easily identify the different rock units. We can easily trace the horizons of tan Cambrian and Ordovician limestones, green Silurian marine sandstones and red Devonian terrestrial sandstones as they get contorted by a complicated set of faults and folds.

Source: NASA Earth Observatory
Just like a man-made geological map, the arrangement of colourful strata contains a lot of information about the structure and geological evolution in this area – information that can be retrieved. The easiest things to spot are the places where the linear ridges jump sideways, offset by strike-slip faults.
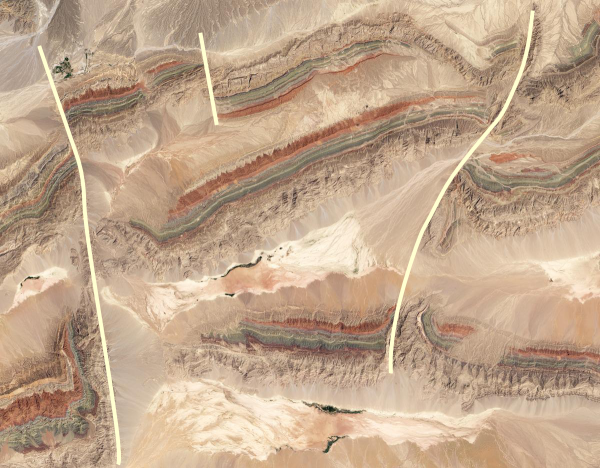
Strike-slip faults cutting through and displacing the multiple ridges composed of multicoloured, dipping Paleozoic rocks.
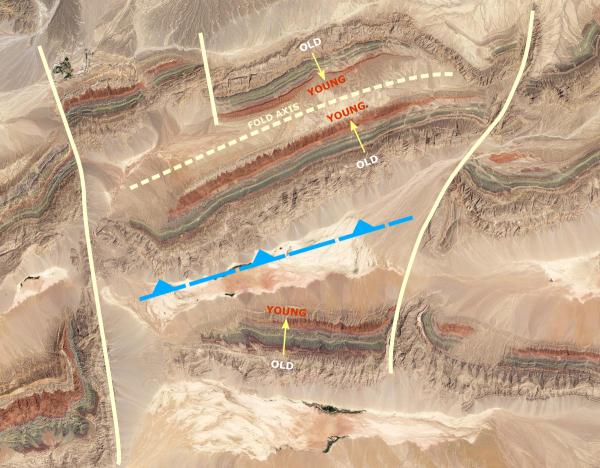
But what of the ridges themselves? There are a number, all running parallel to each other in the same east-west direction, all with the same tan-green-red striping that suggests that we are seeing the same units geologically cut-and-pasted across the landscape. This repetition of the same layers of rock over and over tells us that faults and folds are afoot. Heading south from the top of the image, on the first ridge you would encounter you would cross cream, then green, then red, going up section from the oldest unit to the youngest. But then on the next ridge the order is reversed: continuing south you would cross red, then green, then cream, going down-section from youngest to oldest. This apparent reversal in the flow of geological time tells us that we have crossed a trough-like fold – a syncline. The edges of the trough have been tilted up and eroded, exposing the older rocks, whereas the younger rocks are preserved in the less tumultuous middle. Thus the sequence is mirrored on either side of the east-west trending fold axis, which indicates this fold was formed by north-south compression.
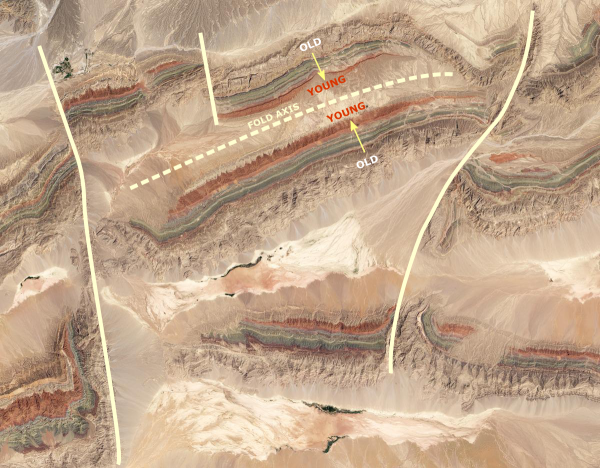
The change from moving up section to moving down section as you traverse the two northern ridges indicates the presence of a syncline – a trough or bowl shaped fold.
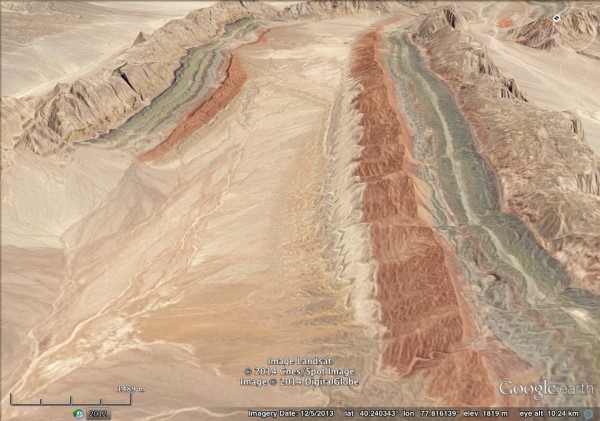
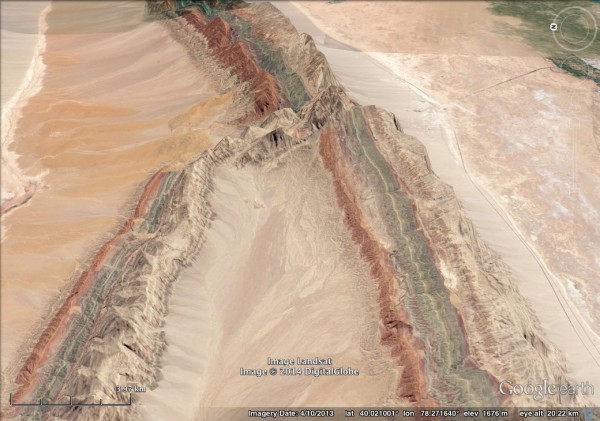
An oblique view clearly shows beds dipping towards the centre of the image, which marks the axis of a syncline.
But what of the third ridge, to the south? Here, the sequence is repeated but not reversed: you would again go down section, crossing red, then green, then cream rock units. Not a simple traverse over another fold axis, then: this repetition is most likely due to faulting. Even when tectonic compression starts off by forming a serious of gentle folds, continued convergence and shortening will make the rocks continue to crumple up: eventually the rock units refuse to bend any more and break up into faulted segments that can then get stacked more closely (imbricated) together.
Interpreted compressional (thrust or reverse fault) between the southernmost two ridges.
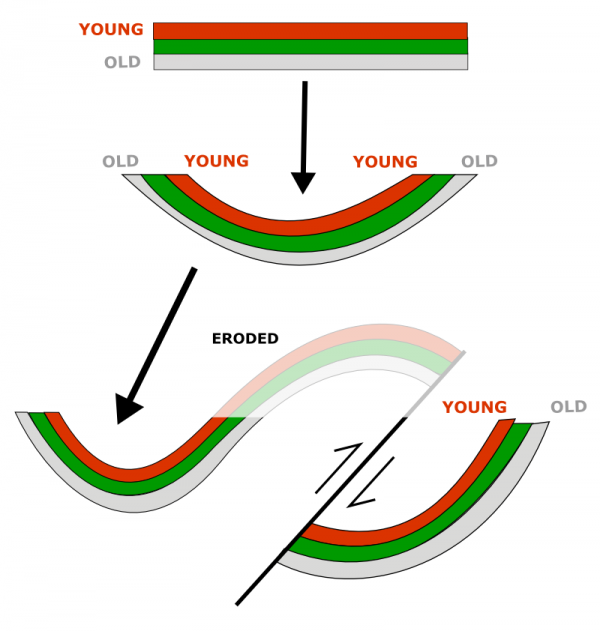
Originally flat lying sediments form a syncline in the northern part of the image, and have been broken apart and stacked by thrust faulting in the south.
For proof of this, we just need to go a little further east, where we get three ridges apparently meeting at a central point.
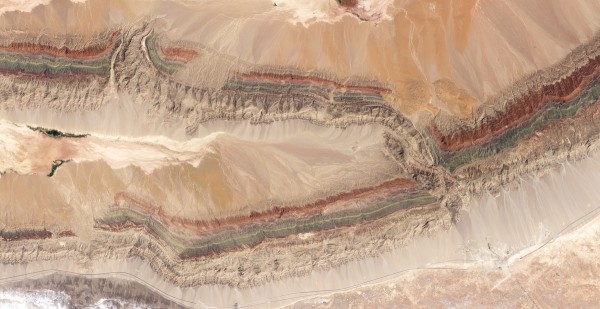
Source: NASA Earth Observatory
It’s a bit of a geometrical headache, until you realise that what we really have is a single ridge running across the top of the image, and the ridge entering from the bottom left simply terminates against it – clear evidence of a fault.
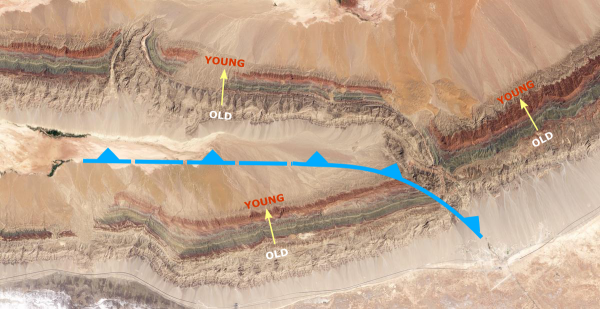
Interpretation of the fault that has caused two ridges to ‘merge’.
It’s even more obvious in oblique view.
An oblique view clearly shows how the ridge on the right terminates against the ridge on the left – a clear sign of a faulted contact.
I really could spend all day looking at this – there’s lots more to see. Grab the KML file from the Earth Observatory page and have a look for yourselves.


Comments (5)