![]() Some of my favorite memories of interacting with my Ph.D. advisor involve long sessions at our conference table, looking at data. I’d come to these sessions armed with many graphs showing data I’d collected and different ways of displaying relationships between them. My advisor came armed with years of experience in looking at data and no paternal attachment to any particular data point. I’d talk him through my data and he’d ask questions. He’d say “Have you thought about this…?” and I’d either scribble furious notes about new ways to explore things, or, in my prouder moments, I’d unveil a graph that showed him exactly what he’d just thought of. Sometimes we’d diagram things or write equations on the white board and I’d leave the meeting filled with ideas and with a few things on the to-do list. Our discussions were incredibly productive, and looking at new data in new ways was clearly the most exciting part of science for both of us.
Some of my favorite memories of interacting with my Ph.D. advisor involve long sessions at our conference table, looking at data. I’d come to these sessions armed with many graphs showing data I’d collected and different ways of displaying relationships between them. My advisor came armed with years of experience in looking at data and no paternal attachment to any particular data point. I’d talk him through my data and he’d ask questions. He’d say “Have you thought about this…?” and I’d either scribble furious notes about new ways to explore things, or, in my prouder moments, I’d unveil a graph that showed him exactly what he’d just thought of. Sometimes we’d diagram things or write equations on the white board and I’d leave the meeting filled with ideas and with a few things on the to-do list. Our discussions were incredibly productive, and looking at new data in new ways was clearly the most exciting part of science for both of us.

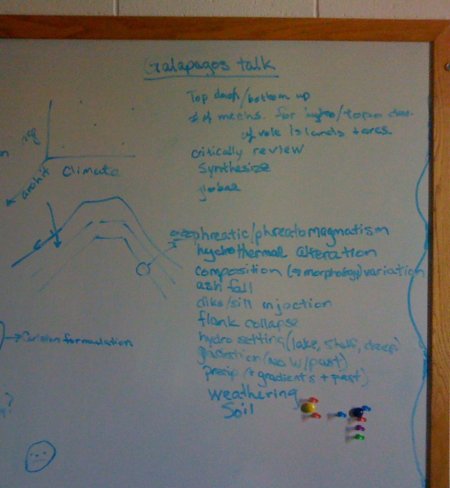
Whiteboard screen grab, July 2011. This is about 1/4 of my total whiteboard. Plus, I've got a much larger one in my lab.
My plea to students, both proximal and distal, is to show your mentors the data. It doesn’t matter if the data aren’t completely polished or that you don’t have everything figured out yet. We want to see it anyways. And showing us the data early and often is a huge benefit to both of us. As I’ve already said, looking at data with students is my favorite part of the job, surely much more fun than writing proposals or, ugh, grading papers. But bringing data offerings to your mentors does more than make us happy; it should help you be a better scientist and a more efficient graduate student.
I know that field work is utterly, obliteratingly exhausting, and that is tempting to shove off the data analysis to some mythical point at which you have bigger chunks of time to make sense of the numbers. But scribblings in your notebook, or points on a datalogger, will never make more sense than when they are freshly collected. Taking some time to translate those scribbles and data points into graphs, coherent tables, or conceptual diagrams, and then taking them to your mentor will allow you and her to catch any problems early on, while there might still be time to go back and collect better or more complete data. You will undoubtedly catch many of these errors yourself, just in the process of making sense of your field notes, and your advisor may spot a few more, particularly errors of omission – data that you didn’t collect that might lend support to what you’ve already done. If you leave all that data analysis to the final months of your schooling, you’ll be far less likely to make right what went wrong and you might find yourself back in the field exactly when you thought you’d be in full-time writing mode.
In addition to error-catching, looking at data early and often with your mentor will help the two of you develop new ways of thinking about your project. For example, my student Ralph and I noticed that some of his downstream sites seemed to have smaller flood peaks than sites farther upstream. This lead to more field work for him, but also the realization that scour holes and log dams in his tiny streams could be major water stores, reducing peak flows in a downstream fashion. It turned out to be a big point in the discussion section of his thesis, and if we hadn’t been looking at the data early on we might not have been able to put the story together.
Finally, talking regularly with your mentor, in the context of the data you are collecting, is a great way of filling in your understanding of where a particular piece of research fits in the big picture and historical context of your field of study. You should definitely have some sense of this from regularly reading the literature (which you are, of course), but your mentor probably has a richer vein to mine for thinking about how your new results fit in with what other people are scientists are finding now (or found a century ago). It’s not that your mentor is any smarter than you, she’s just had longer to read the literature, go to conferences, and think about how all the pieces fit together.
While what I’ve written above is aimed primarily at graduate students, it is still true for undergraduates with class projects and labs. Most of us professors would much rather talk over your assignments with you and make sure you understand what is going on *before* you turn the assignment in, than have to give you a lousy grade and explain why afterward.
Making use of your mentors and showing them the data is also true for those of us in the post-PhD ranks. Sometimes we’re talking through data with collaborators, rather than people in more senior positions, but the aim is the same…”Am I forgetting anything? Does this result make sense? “What happens if we think about it this way?” And sometimes I still call my old advisor: “Hi Gordon, I’m getting this really weird result, and here’s what I think is going on. What do you think?”


Comments (5)
Links (2)-
-
Pingback: Data sharing with PI for nurturing feedback « Biochemistry, Molecular, Cellular & Developmental Biology
Pingback: Wisdom from the Geoblogosphere School of Learning & Doing (Accretionary Wedge #38) | Highly Allochthonous