![]() On Friday 11 March 2011, when the fault ruptured off of the Japanese coast in a M9.0 earthquake, it caused a sudden vertical movement of the seafloor, displacing the water above it and transferring energy to the ocean. As the water returned to place (thanks, gravity!), the energy was transferred outward across the ocean in all directions. Just like when a pebble is thrown into the water, multiple tsunami waves were generated from a single disturbance.
On Friday 11 March 2011, when the fault ruptured off of the Japanese coast in a M9.0 earthquake, it caused a sudden vertical movement of the seafloor, displacing the water above it and transferring energy to the ocean. As the water returned to place (thanks, gravity!), the energy was transferred outward across the ocean in all directions. Just like when a pebble is thrown into the water, multiple tsunami waves were generated from a single disturbance.
In deep water, tsunami move about 400 km/hr and the surface displacement (wave height) is relatively small. That’s why, if it’s known that a tsunami is on its way, boats will leave harbor and head out to deep water. As the tsunami approaches the shore, it slows and the wave heights increase. The Japanese word tsunami actually means “harbor wave”, because it is only close to shore that it is easily spotted.
Along the east coast of northern Honshu Island, Japan, the tsunami struck shortly after the earthquake and with such overwhelming height and power that it flattened almost everything in its path. By far, most of the death and destruction in Japan is from the tsunami, and not the earthquake itself.

Tsunami propagation near Japan, 11 March 2011 from http://supersites.earthobservations.org/201103_Tsunami_DrSatake.gif
One of things to notice in the animation above is that the tsunami took much longer to reach the city of Sendai (which is in the big bay area) than the coastlines to the north and south. According to that animation, villages to north of the bay would have had as little as 20 minutes between earthquake and tsunami, to the south of the bay it was 40 minutes or more (because the coast was farther from the epicenter), and within the bay, there was more than an hour between earthquake and tsunami (although this model may not fully capture the non-linear wave interference and refraction within bays).
Whatever the warning time, the sheer magnitude and force of the tsunami greatly exceeded anything the Japanese people had experienced since modern record keeping began. Approximately, 40% of the Japanese coast is lined with sea walls of varying heights, but as the New York Times describes, these sea walls provided little barrier to the March 11 tsunami. Worse, these seawalls may have lured coastal dwellers into a false sense of security and obscured their views of receding waters in advance of the oncoming tsunami. As a hydrologist, I was struck by the similarity of the problems with sea walls to the ones associated with levees along flood-prone rivers. The combination of under-engineering and complacency is a deadly combination when a major tsunami, flood, or hurricane strikes. Add to that a high percentage of elderly people in the Japanese population, and you have even more of a tragedy.
Of course, only some of the ocean’s energy as a result of the earthquake headed toward Japan. The rest spread out over the open Pacific ocean toward scattered islands, New Zealand, and the west coast of North and South America. The video (below) from NOAA shows how the tsunami interacted with ocean bathymetry as it sped across the Pacific. As the narrator says, be sure to notice how complicated the wave patterns get as they bounce off obstacles on the ocean floor.
Given the vast expanse of the Pacific Ocean, the rest of the world had the luxury of both time to prepare for the tsunami and the dispersion of energy to reduce its impact. The Pacific Tsunami Warning Center modeled and tracked the wave energy as it advanced toward Hawaii and the US West Coast. As these pdf plots from the NOAA Center for Tsunami Research show, the model predictions and actual tsunami heights and arrival times match pretty closely for Hawaii and Pacific Islands, US West Coast, and Alaska.
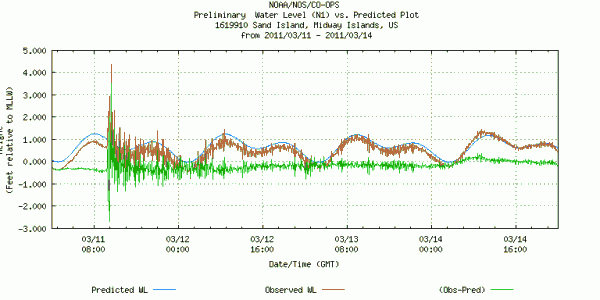
Away from Japan, the wave height of the tsunami varied greatly with location, depending on coastal geometry and near shore water depth. Topography above mean sea level also affected the tsunami’s impact. On Midway atoll, the tsunami reached a peak height of only ~1.3 m above mean lower low water level, but 10,000 albatross chicks were washed away from their flat island nesting areas.

Sea level data for Sand Island, Midway for 11-14 March 2011 (plot from NOAA). The brown line is the observed sea level, and the green line shows the difference between the observed and predicted (non-tsunami) levels.
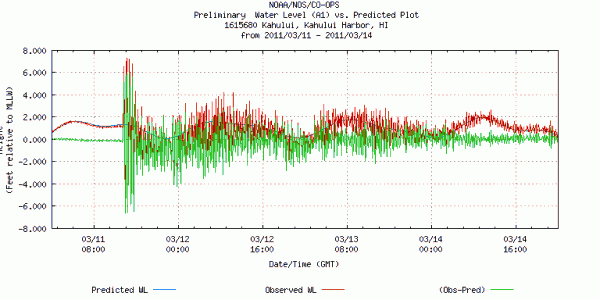
In Hawaii, the biggest tsunami wave was seen in Kahului Bay on Maui.

Sea level data for Kahului, Hawaii for 11-14 March 2011 (plot from NOAA). The red line is the observed sea level, and the green line shows the difference between the observed and predicted (non-tsunami) levels.
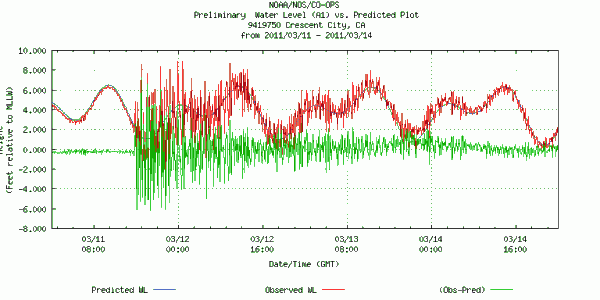
On the US west coast, the tsunami struck near low tide and in many places it was barely visible to observers on shore. Nonetheless, officials in coastal areas did the right thing by closing beaches and ordering evacuations. In Crescent City, California, which has a pecular tsunami-magnifying coastal geography, the maximum wave height exceeded 2.5 m, and several million dollars of damage was done to the harbor. A bit farther north, people were swept out to sea, resulting in one death.

Sea level data for Crescent City, California for 11-14 March 2011 (plot from NOAA). The red line is the observed sea level, and the green line shows the difference between the observed and predicted (non-tsunami) levels.
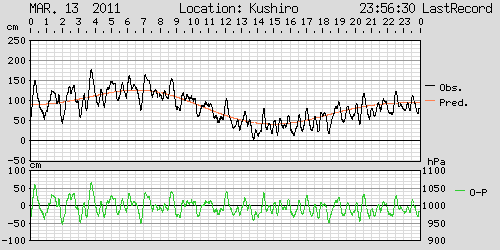
In the water level graphs posted above, the initial few hours of the tsunami impact clearly stand out. But a bit closer look reveals that water was still reverberating and sloshing around the Pacific Ocean in unusual ways for several days after March 11th. As this tidal gage from Kurushiro, Japan, on Hokkaido Island, well north of the worst tsunami effects, shows, on March 13, two days after the earthquake, water levels were still fluctuating by almost a meter relative to their normal levels and at much greater frequency than the tidal cycle.

Sea level at Kurushio, Japan, 13 March 2011. Plot from the Japanese Meteorological Academy: http://www1.kaiho.mlit.go.jp/KANKYO/TIDE/real_time_tide/sel/1203_e.htm
Finally, I’d like to remind residents of and visitors to the US and Canadian west coast that you are sitting in a nearly identical tectonic situation to the one that produced the Sendai earthquake and its tsunami. Like the Japanese victims, a major earthquake off the North American west coast would give you minutes, not hours, to get to high ground. Worse, we are way behind Japan in terms of earthquake and tsunami preparedness and awareness. Only now is a US city designing its first tsunami resistant building, despite a paleo-record of earthquakes and tsunami as large as that in Japan. You can listen to paleo-seismologist Brian Atwater talk about discovering ancient tsunami deposits and watch this USGS animation of a hypothetical tsunami along the Pacific Northwest. Americans have some important lessons to learn from the Sendai disaster – about the force of nature, the limits of engineering, the value of preparedness, and the ease with which some shaking ground and a wall of water can wipe away all of the comforts of modern society along with thousands of human lives. We owe it to the Japanese people to learn from their tragedy.


Comments (3)
Links (3)-
-
-
Pingback: Reverberations of the Honshu tsunami – Anne Jefferson – HighlyAllochthonous | Hating God - With due respect and all
Pingback: Sendai/Tohoku earthquake round-up | Highly Allochthonous
Pingback: Reverberations of the Honshu tsunami « Watershed Hydrogeology Blog