
![]() As part of Earth Science Week and as a diversion from the frantic lead-up to the Geological Society of America meeting, we’re helping push the Geobloggers Giving Kids the Earth challenge. As I announced yesterday, for every one of the five projects that I’ll be highlighting this week that is fully funded by the end of the week, Chris or I will write a post on the earth science topic chosen by our readers. Yesterday, we had two generous donors help ensure that Louisiana high school students got their water quality testing kits.
As part of Earth Science Week and as a diversion from the frantic lead-up to the Geological Society of America meeting, we’re helping push the Geobloggers Giving Kids the Earth challenge. As I announced yesterday, for every one of the five projects that I’ll be highlighting this week that is fully funded by the end of the week, Chris or I will write a post on the earth science topic chosen by our readers. Yesterday, we had two generous donors help ensure that Louisiana high school students got their water quality testing kits.
 Sticking with the water theme for now, since after all Earth is 71% covered by salt water, let’s turn our attention to an oceanography project that needs just $213 of donor money to complete. “How Salty is the Sea?“, is from a high poverty high school along the North Carolina coast. This project is a fantastic deal for donors, because the Bill and Melinda Gates Foundation is doubling our donations. The total cost for 5 refractometers and associated necessary charges is $602, but between the foundation and previous donations, we only need to raise the last $213. The enthusiastic teacher, pictured at left, writes:
We live in an area that is undergoing rapid change and development, all of which is not necessarily viable and good. One of the environmental tipping points of our area might just be the decline of the quality of the water that surrounds our community. As a teacher, I would like to facilitate the study of the water salinity that surrounds us, testing estuarine water, the sound and the ocean. I would like to provide my marine Science and/or Environmental Science students with refractometers that are easy to use but accurate. I would like for my students to test the salinity of the water at different sites around our school campus and community and at different times of the year. With the refractometers, we should be able to test the waters, then we can use the data to compare influences in our outcomes: Will weather be a factor? Will temperature affect salinity? Does depth affect the sample? How are organisms affected by salinity rates? Once all the data is collected, my students can research our findings and make our data analysis charts.
The concept of measuring salinity in sea water might strike some as overly simple, but as someone who teaches first year university students a course with a section on the ocean, I can tell you first-hand that the concept of salinity varying in space and time is completely new to most of my students. When I show a map like the one below and ask them to explain it, most struggle mightily.
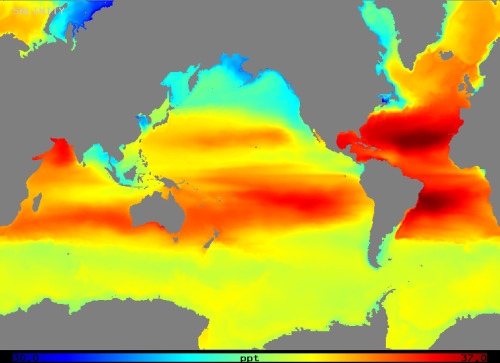
Map of mean sea surface salinity from a web page at Penn State. Can you explain the pattern?
If they knew about things like the brine lake described in the David Attenborough video below, they’d be even more astonished.
Give these North Carolina high school students the chance to unlock some of the mysteries of the ocean right outside their school. They’ll look positively brilliant compared to their future college classmates. But if you’re not a sea dog, look for tomorrow’s meteorology project. Thursday’s the day for rocks and more rocks, and Friday is going off with a boom. Remember, while we’ll be highlighting one project each day, all projects are part of the challenge and for each one completed by the end of the week, Chris or I will write a post on the topic of your choosing. Don’t like one of the five I’ve picked, then take a look at the rest of the Geobloggers Giving Kids the Earth giving page and find the one the best suits your fancy.


Comments (3)