[A guest post from hydrogeologist Anne Jefferson]
Last week, the Southeastern United States received several inches of snow. This late season snowfall was certainly a novelty, though not an unprecedented occurrence. But it did stir up conversations among local residents, especially when the week ended with ~25 degree Celsius (75 Fahrenheit) sunshine. The weather’s fickleness also got me thinking about climate variability and climate change and how easily we can slip up and confuse the two. I even see scientists (who should know better) conflating variability and change, so below I offer a short, illustrated tutorial on the differences.
Hydrometeorological variables – things like precipitation, streamflow, groundwater levels, temperature, and humidity – are often expressed as annual or seasonal averages. The average value of one of those variables over 30 years is called a climatological normal. Below, I’ve illustrated a hypothetical climate variable as it varies over a 30 year period. These normals are redefined every 10 years, so right now we are using 1971-2000 as our normal period.

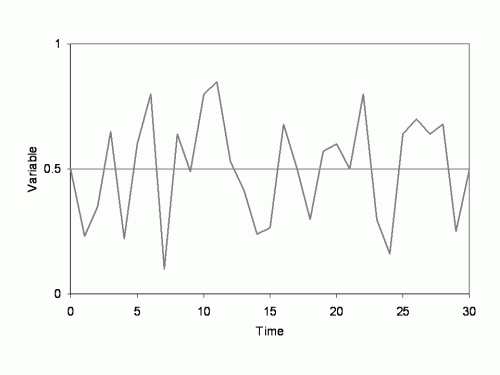
Figure 1. A hypothetical climate variable through time
The average value of the variable is 0.5, and the squiggles above and below the mean represent climate variability. I’ll define climate variability as the oscillations around a mean state. (An aside: it’s fairly common to see a few years in a row that are below the mean or above the mean. This phenomenon, known as serial correlation, occurs where the value of a variable is influenced by the values that precede it. As an example, if you have a severe drought one year, even if it rains more than normal the next year, streamflow may stay quite low as groundwater is replenished. This is what is happening in the southeast now after our 2007 drought.)
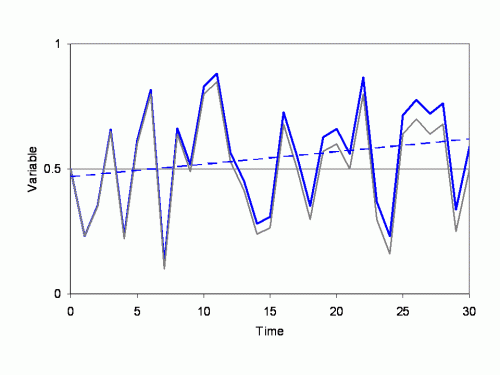
Variability, then, is all about the oscillations; it doesn’t tell you anything about what’s happening with the mean. Below, I’ve illustrated the same time series shifted progressively by 0.003 per time step. Here the mean is changing, while the variability stays the same.

Figure 2. A hypothetical climate variable in blue is trending by 0.003 per year (with the non-trending time series in gray for comparison)
As in the illustration above, variables like average temperature and sea surface temperature are experiencing changes in their mean values. So, climate change can take the form of a trend in the mean value of a variable over time. A climatological variable experiencing change in the mean would not have the same “normal” values from one climate normal period to the next.
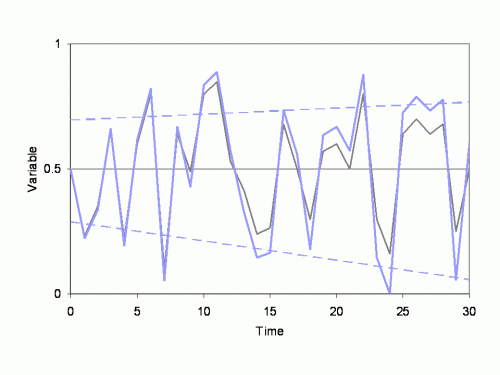
But climate change can also affect the variability of a variable, as illustrated below. Here the mean is not changing, but I’ve made below-mean points successively lower by 0.0067 per time step and above mean points are successively higher by 0.00347 per time step.

Figure 3. A hypothetical climate variable (blue) showing an increase in variability with time (gray line is the variable with unchanging mean and variability)
This sort of change is the sort of change we might see in precipitation in some areas. For example, the Southeastern United States is predicted to have more intense summer rainfall and more intense droughts as a result of anthropogenic climate change, and retrospective trend studies suggest that this may already be the case. Even though the mean precipitation is not changing, the Southeastern United States is still experiencing a climate change effect manifested in a change in climate variability.
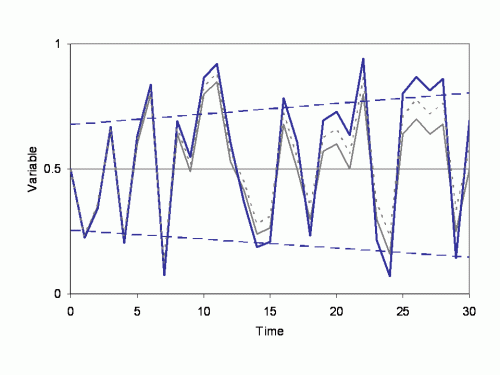
Finally, climate change can take the form of a trend in the mean and a trend in the variability, as shown below.

Figure 4. A hypothetical climate variable with changing mean and variability (gray solid line indicates variable with unchanging mean and variability, gray dotted line has a changing mean without changing variability)
This final pattern may be the case for streamflow in some regions. Mean streamflow could decrease because of increasing evapotranspirative losses in a warmer climate, and streamflow variability could increase because of changes in precipitation and drought intensity. This sort of complicated pattern may occur for other climatological variables as well.
So what does this mean for “freak” late winter snowstorms in the southeastern United States? Climate change trending towards warmer temperatures makes frozen precipitation less likely (Figure 2), but given the variability inherent in meteorological systems (Figure 1), I wouldn’t rule it out entirely. But the snowshoes in my garage are still feeling a bit neglected.


Comments (2)