
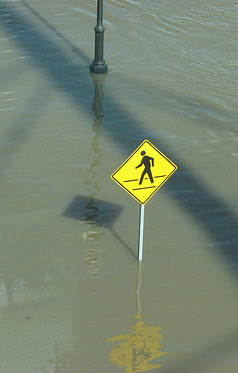
 For the past week, the flooding in the Upper Midwest has been all over the news, as rivers have reached record levels and thousands of people have been evacuated across several states. A couple of ScienceBloggers have been personally affected, and we hope that they, their families, and their labs continue to be safe and dry.
Floods are a personal fascination for me, as I can trace my interest in hydrology directly to the 1993 Mississippi River floods that affected my hometown in Minnesota. However, flood recurrence intervals are also one of my professional pet peeves. I make sure that students in my classes never walk away with the misconception that a 500-year flood can only happen once every 500 years. If you finish reading this post, you’ll be disabused of the notion as well.
The most important point is that a “X-year flood” is a poorly-chosen way of expressing the probability of a flood of a given magnitude happening in a given year. A 500 year flood, has a probability of 1/500, or 0.2% of happening in any given year. Just like when you flip a coin the probability of getting heads is always 50% on the next flip, even if you happen to get heads three times in a row. In the same way, if a river has a 500-year flood in 2008, there is the same probability of having such a big event in 2009. That’s bad news for those flood victims with a poor understanding of probability. Fortunately, a quick scan of this round of media coverage has revealed very few reporters getting it wrong (and some news outlets even taking time to get it right).
Flood probabilities are based on historical records of stream discharge. Let’s use the Iowa River at Marengo, Iowa as an example. It reached a record discharge of 46,600 cubic feet per second* (1320 m3/s) on 12 June. That flow was estimated to have a 500 year recurrence interval, based on 51 years of peak flow records. Here’s a graph of the peak flow record for the site:
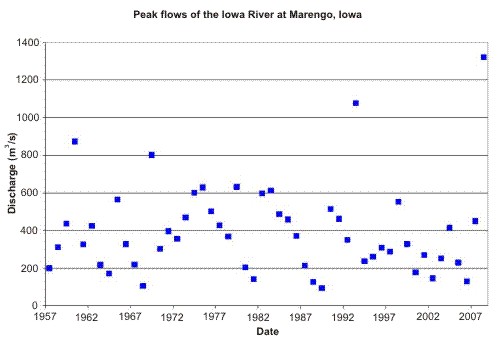
Typically flood probabilities are based on a time series of the highest instantaneous discharge measured during a given water year (1 October to 30 September). These data are then fitted to a statistical distribution, often this one. These distributions then allow the estimation of the probability (or recurrence interval) of a flood of a given magnitude. Taking the peak flow time series from the USGS website and using the distribution above, I also get a ~500 year recurrence interval (0.2% probability) for the flood of 2008. But there’s a big problem here…I’m estimating a 500-year flood based on only 51-years of record. So I’m going beyond my data by a factor of 10!
When you are extrapolating beyond your data by an order of magnitude, the highest points in the dataset start to have a lot of leverage. Let’s imagine that there’s another big flood on the Iowa River next year and we do the same analysis. Now our dataset has 52 points, with the highest being the flood of 2008. When that point is included in the analysis, a discharge of 46,600 cubic feet per second* (1320 m3/s) has a recurrence interval of <150 years (>0.6%). It’s still a darn big flow, but it doesn’t sound quite so biblical anymore.
OK, so our predictions of the probability (recurrence interval) of big floods can be really wrong just because of the limited nature of historical data (the situation is better in some other parts of the world). But there are a number of other possible confounding factors. First, erosion or deposition of the channel and surrounding regions over time can change the height of the flood relative to the volume of the flood. And flood height is what those people manning the sandbags really care about. Second, changes in the watershed can affect how much and how quickly precipitation makes it to the river. Urbanization and the adding of impervious surface is one cause of increasing flood peaks, but in Iowa, a more likely culprit is agricultural. Between the 1780s and 1980s, more than 95% of Iowa’s wetlands had been drained. (Most of this drainage occurred prior to the 1930s in Iowa, so it is unlikely to affect the example above.) Conversely, flood control dams (like Coralville Dam on the Iowa River) can suppress flood peaks downstream. Another potential culprit is climate change, though it is nearly impossible to attribute the occurrence or magnitude of any one event to changing climate.
All right, with all of that under your belt, the next time you hear someone say something like “They said 1993 was a 500-year flood. How can we be having another one only 15 years later?” you can patiently explain to him that recurrence intervals are only shorthand for probabilities. The hydrology professors of the world will thank you.
*Still the standard units for reporting discharge in the U.S.
Comments (21)
Links (2)-
-
Pingback: Anne’s picks of the literature: river and floodplain sediments | Highly Allochthonous
Pingback: Anne’s picks of the literature: river and floodplain sediments « Watershed Hydrogeology Blog