
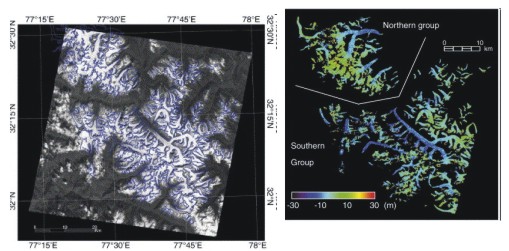
I’d like to call your attention to a couple of interesting images that I’ve come across in the past couple of days. The first is from a study by Berthier et al., who used remote sensing techniques to analyse changes in the extent of Himalayan glaciers in response to climate change. It seems that the dynamics of the Himalayan ice sheet are rather poorly known, due to the difficulties of actually getting out and doing a proper survey. Berthier et al. compared satellite altimetry data from two surveys of the area shown on the left below, in February 2000 and November 2004. The image on the right shows the differences in measured elevation between these two surveys, presumed to be the result of ice loss or accumulation. Large losses from the main glaciers, particularly at lower altitudes, are clearly evident; higher up, there are patches of increase and decrease. In total, the 915 km2 of glaciers surveyed (3% of the 33,000 km2 in the Himalayas as a whole) are calculated to have lost 3.9 km3 in the 5 years between the measurements.
The second image, from a study by Williams et al., shows the output of a climate model which attempts to assess the effects of climate change on biodiversity, by looking at the appearance of ‘novel climates’ (yellow), and the disappearance of present day ones (blue), in the next century. I dug it up because the standard press releases rather annoyingly decided not to include it, despite the fact that it’s hard to assess the importance of the results without it. I eventually found it on the UW-Madison website (click on the image for a larger version).

I assume the classification is something to do with distinct combinations of temperature range and precipitation. As a warming world will shift present climatic zones northward and upward, it is unsurprising that it is mostly low latitudes that see novel climates appearing, and high latitudes and altitudes that see present climates disappearing. More interesting (from both a scientific and policy perspective) is the significant difference in the spatial extent of the changes between the low emissions and high emissions scenarios: do intermediate scenarios show a gradual change between the two, or is there a sudden increase in the severity of change across some threshold CO2 concentration? They also seem to have missed off the oceans…
Comments (2)